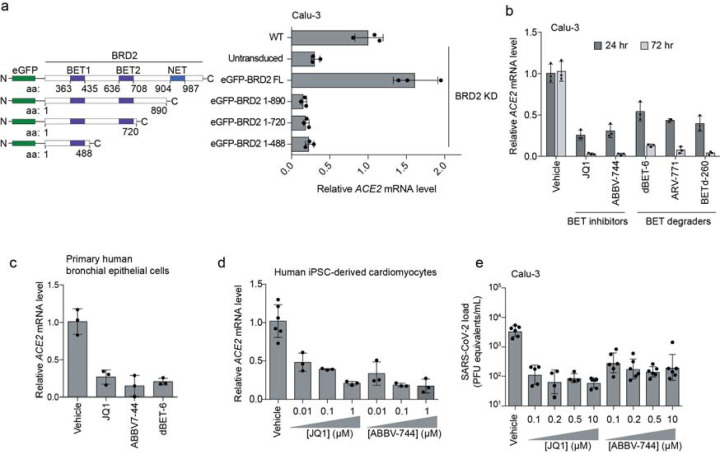
Figure 3: BRD2 inhibitors potently reduce ACE2 levels and SARS-CoV-2 infection.
a, Transgenic constructs expressed in Calu-3 cells (left). Transcript levels of ACE2 relative to ACTB in Calu3 cells transduced with eGFP-BRD2 truncations in a BRD2 knockdown background (right). ACE2 expression is relative to WT. Average and standard deviation of technical triplicates are shown for each transduced construct. b, Transcript levels of ACE2 relative to ACTB in Calu3 cells treated with BRD2 inhibitors (JQ1 at 10 μM, ABBV-744 at 10 μM and dBET-6 at 200 nM) were quantified at 24 (dark grey bars) and 72 hours (light grey bars) post-treatment. Average and standard deviation of technical triplicates are shown for each condition. c, Transcript levels of ACE2 relative to ACTB in primary human bronchial epithelial cells treated with BRD2 inhibitors (JQ1 at 10 μM, ABBV-744 at 1 μM and dBET-6 at 20 nM) were quantified at 72 hours post-treatment. Average and standard deviation of technical triplicates are shown for each condition. d, Transcript levels of ACE2 relative to 18S rRNA in human iPSC-derived cardiomyocytes treated with the indicated concentrations of BRD2 inhibitors were quantified at 72 hours post-treatment. Average and standard deviation of 3 or more biological replicates are shown for each condition. e, SARS-CoV-2 viral RNA in the supernatant measured by RT-qPCR 24 hours post-infection of Calu-3 cells infected 72 hours after treatment with the indicated concentrations of BRD2 inhibitors. Average and standard deviation of four or more biological replicates are shown for each condition.

