
Extended Data Figure 5: Non-toxic concentration range of BRD2 inhibitors.
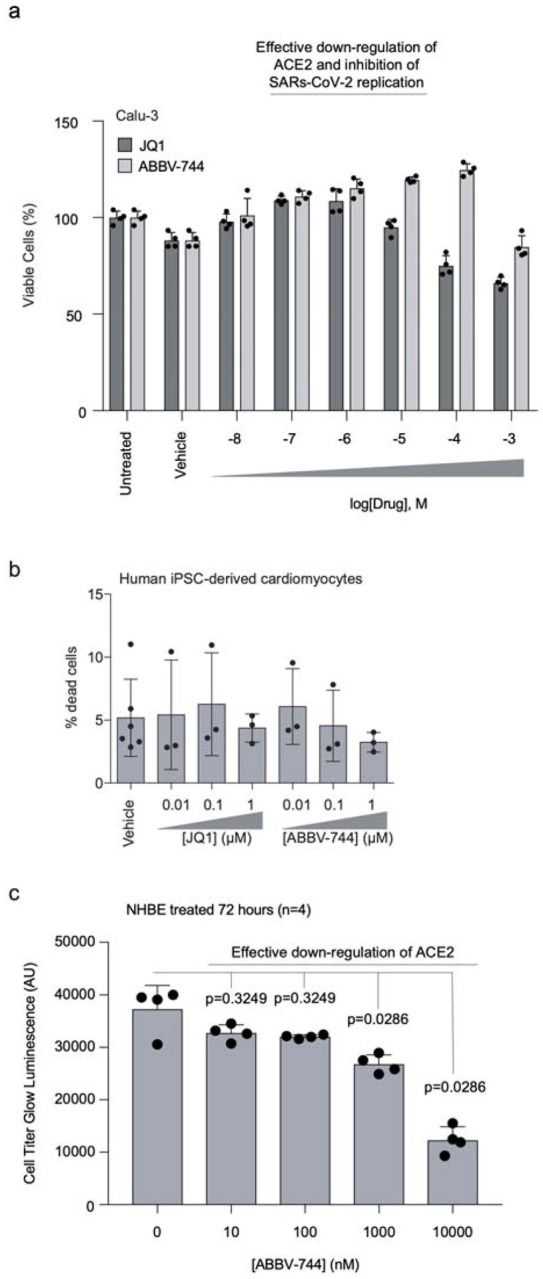
a, Calu-3 cells were treated with vehicle or the indicated concentrations of JQ1 or ABBV-744 for 5 days. Cell viability was then assayed with CellTiter-Glo 2.0 to calculate viability. Error bars represent the standard deviation of four biological replicates. b, Human iPSC-derived cardiomyocytes were treated for 72 hours with vehicle or the indicated concentrations of JQ1 or ABBV-744, and the percentage of dead cells was quantified as the ratio of propidium iodide-positive cells (dead cells) over Hoechst-positive cells (all cells). Error bars represent the standard deviation of three biological replicates (six biological replicates for the vehicle condition). c, Primary human bronchial epithelial (NHBE) cells were treated with ABBV-744 at the indicated concentrations for 72 hours and toxicity was assessed using CellTiter-Glo 2.0. Error bars represent the standard deviation of four biological replicates. P-values determined using Mann-Whitney two tailed test.