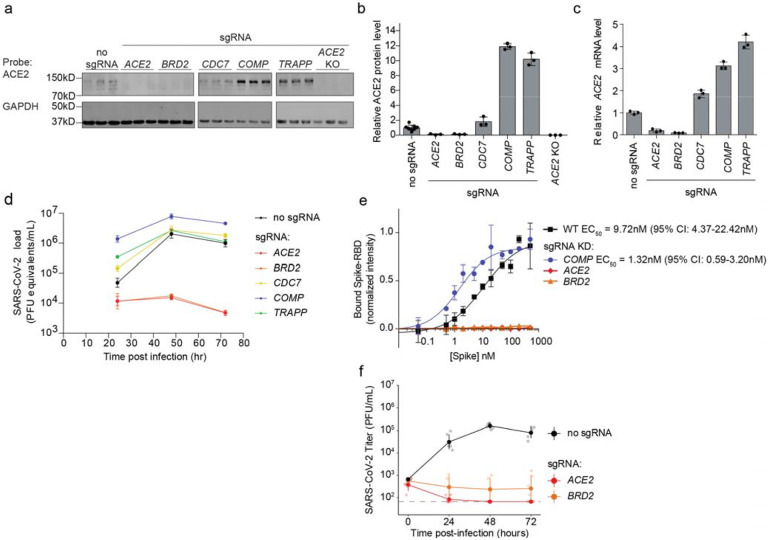
Figure 2: Hit genes modulate ACE2 levels and SARS-CoV-2 infection.
a, Western blotting for ACE2 and GAPDH in Calu-3 CRISPRi cells expressing no sgRNA or sgRNAs targeting different hit genes, or ACE2 knockout Calu-3 cells. Three lanes represent biological triplicates for each cell line. b, Quantification of ACE2 protein levels relative to GAPDH based on the data in (a). Average and standard deviation for three biological replicates are shown. c, Relative amounts of ACE2 transcript levels measured by qPCR in Calu-3 CRISPRi cells expressing sgRNAs targeting different hit genes, compared to cells without sgRNA. Average and standard deviation for three technical replicates are shown. d, Calu-3 CRISPRi cells expressing different sgRNAs targeting hit genes were infected with SARS-CoV-2 and viral RNA in the supernatant measured by RT-qPCR as a function of time post-infection. Average and standard deviation of three wells are shown. e, Spike-RBD binding to Calu-3 cells was quantified by flow cytometry of Calu3 cells expressing sgRNAs targeting individual hit genes after incubation with increasing concentrations of Spike-RBD. For genes for which data could be fitted with a binding curve, the EC50 was determined along with the 95% confidence intervals. Data points are average values from three biological replicates for each gene knockdown with error bars representing the standard deviation, except for ACE2 and BRD2 where only one experiment at each concentration was performed. f, Plaque assays in Calu-3 CRISPRi cells expressing different sgRNAs targeting hit genes were infected with SARS-CoV-2 as a function of time post-infection. Average and standard deviation of six biological replicates are shown.

