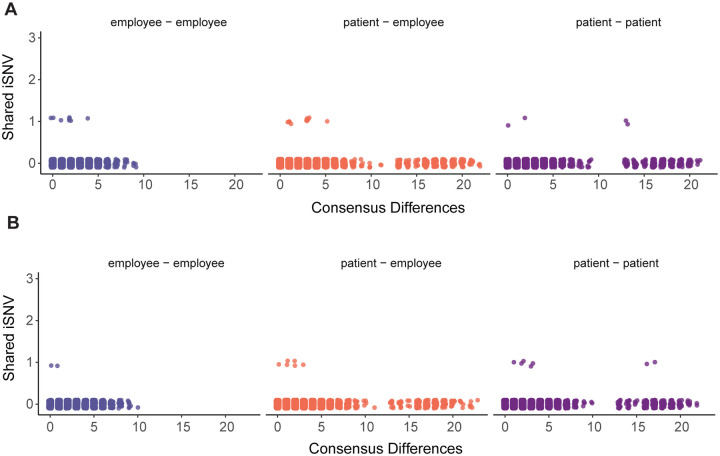
Figure 5.
Pairwise comparisons of shared iSNV. Each unique pair is shown as a single point, with employee-employee pairs in violet (left), patient-employee pairs in orange (middle), and patient-patient pairs in purple (right). The number of iSNV shared by each pair is shown on the y-axis with the number of consensus differences between the pair of genomes on the x-axis. Pairs of samples collected within seven days of each other are displayed in (A), and pairs of samples collected greater than seven days apart are shown in (B).

