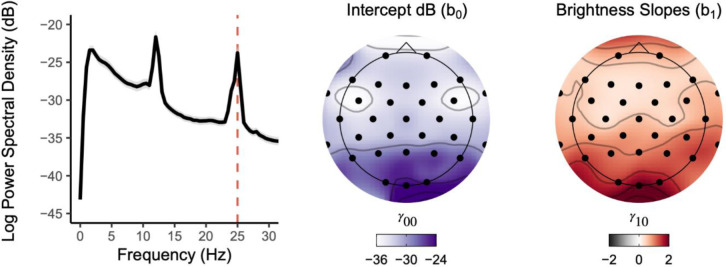
Figure 3. The unpleasant checkerboard stimuli presented at 25Hz evoked widespread robust SSVEPs focused at Oz.
Left. Broadband PSD averaged across the five presented brightness intensities for all participants shows a clear peak at the 25Hz SSVEP alternating checkerboard frequency. Grey shading denotes 95% confidence interval. Middle. Topographically plotted intercepts demonstrated elevated PSD estimates toward occipital electrode sites. Right. Topographically plotted regression slopes show scalp-wide positive slopes, especially at occipital sites and Oz, demonstrating an increase in SSVEP PSD estimates with increasing brightness intensities. All topographic sites for intercept and slope effects were significant after correcting for multiple comparisons (pFDR < .001).

