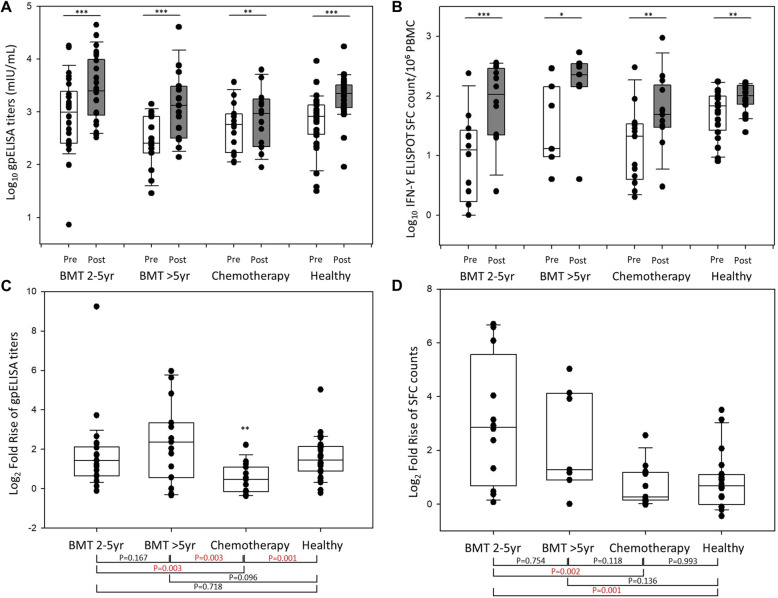
Fig. 2.
Varicella-zoster virus-specific humoral immune responses measured in a glycoprotein ELISA (gpELISA) assay before and at 6 weeks post-vaccination (a) and Log2-fold increases in the gpELISA titers (c) for each study group. Varicella-zoster virus-specific cellular immune responses, measured using the enzyme-linked immunospot (ELISPOT) assay, before and at 6 weeks after vaccination (b) and Log2-fold increases in spot-forming cell (sfc) counts (d) for each study group. The edges of the boxes represent the 25th and 75th percentiles, the horizontal lines inside the boxes are the median values, and the vertical whiskers represent the 2.5th and 97.5th percentiles (* p < 0.05, ** p < 0.01, *** p < 0.001)

