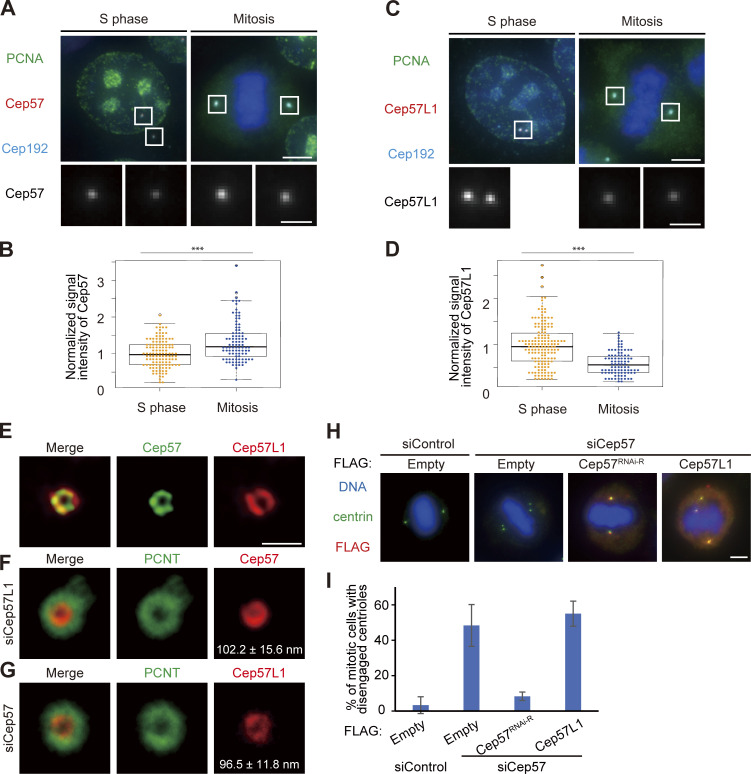
Figure S3.
Cep57 and Cep57L1 independently localize around mother centrioles. (A) Cep57 is more associated with mitotic centrosomes than those of interphase. HeLa cells were immunostained with antibodies against PCNA (green), Cep57 (red), and Cep192 (cyan). Scale bars, 5 µm in the low-magnification view, 1 µm in the inset. (B) Beeswarm plots piled on boxplots represent the normalized signal intensity of Cep57 at the centrosomes in the S phase and mitosis (n = 50). (C) Cep57L1 is more associated with interphase centrosomes than those of mitosis. HeLa cells were immunostained with antibodies against PCNA (green), Cep57L1 (red), and Cep192 (cyan). Scale bars, 5 µm in the low-magnification view, 1 µm in the inset. (D) Beeswarm plots piled on boxplots represent the normalized signal intensity of Cep57L1 at the centrosomes in the S phase and mitosis (n = 50). (E) STED images representing top view of Cep57L1 (red) and Cep57 (green) at mother centrioles. (F) STED images representing top view of Cep57 (red) and PCNT (green) at mother centrioles upon siRNA treatment against Cep57L1. (G) STED images representing top view of Cep57L1 (red) and PCNT (green) at mother centrioles upon siRNA treatment against Cep57. Note that the radius of the Cep57L1 ring was significantly smaller in Cep57-depleted cells than in control cells (P < 0.05). Scale bar, 500 nm in E–G. (H) Precocious centriole disengagement in mitosis induced by Cep57 depletion was not rescued by exogenous expression of Cep57L1. HeLa cells were treated with siControl or siCep57/Cep57L1, followed by transfection with FLAG empty (control), FLAG-Cep57 (RNAi resistant [RNAi-R]), or FLAG-Cep57L1. The cells were immunostained with antibodies against FLAG (red) and centrin (green). (I) Histograms represent the frequency of cells in mitosis with precocious centriole disengagement in each condition observed in H. Values are percentages from two independent experiments (n = 30 for each experiment). Scale bars, 5 µm in the low-magnification view, 1 µm in the inset, except STED images in E–G. The normal distribution of datasets was confirmed using the Kolmogorov–Smirnov test in B and D. A two-tailed, unpaired Student’s t test was used in B and D to obtain the P value. ***, P < 0.001.

