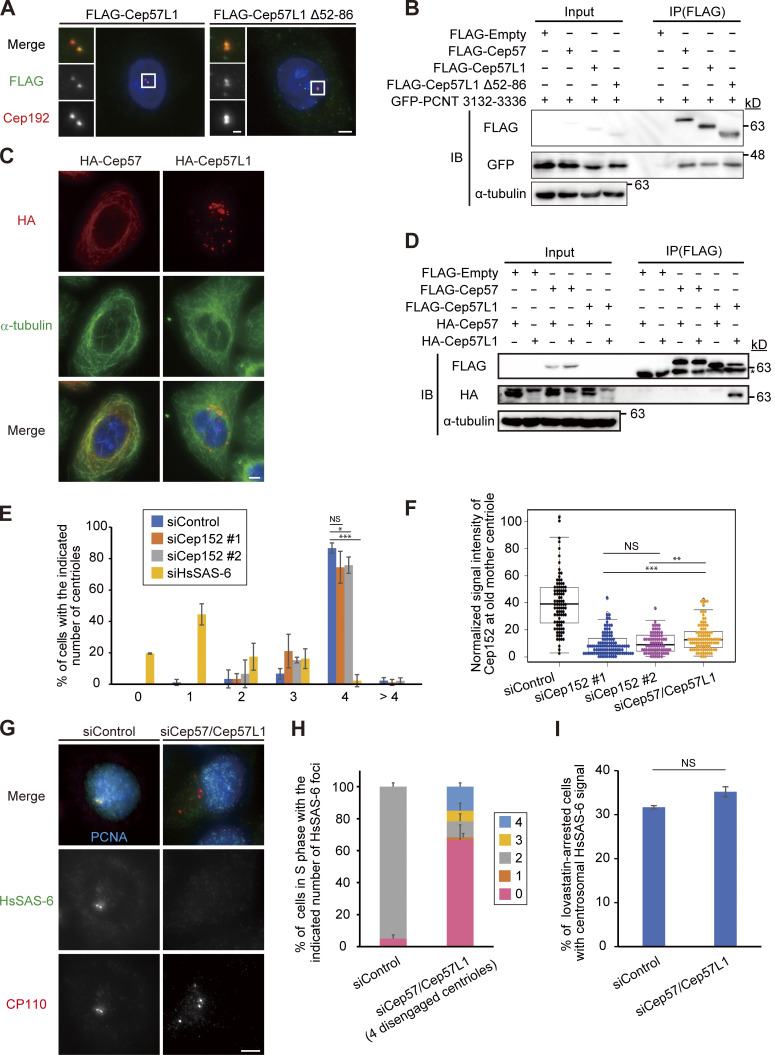
Figure S4.
Cep57 and Cep57L1 show distinct molecular properties. (A) The Cep57L1 PINC motif was not required for the centrosomal localization. HeLa cells expressing FLAG-Cep57L1 or FLAG-Cep57L1 mutant lacking the PINC motif (Δ52–86 aa) were immunostained with antibodies against FLAG (green) and Cep192 (red). (B) The Cep57L1 PINC motif was not required for binding to the C-terminal region of PCNT containing the conserved PACT domain. HEK293T cells coexpressing FLAG empty (control), FLAG-Cep57, FLAG-Cep57L1, or FLAG-Cep57L1 mutant lacking the PINC motif and GFP-PCNT (3132–3336 aa) were immunoprecipitated with FLAG antibodies and immunoblotted with the indicated antibodies. (C) Overexpressed Cep57 was accumulated on the microtubules, but overexpressed Cep57L1 aggregated in the cytoplasm. HeLa cells expressing HA-Cep57 or HA-Cep57L1 were immunostained with antibodies against HA (red) and α-tubulin (green). (D) Cep57L1 formed a homodimer. HEK293T cells coexpressing FLAG empty (control), FLAG-Cep57 or FLAG-Cep57L1, and HA-Cep57 or HA-Cep57L1 were immunoprecipitated with FLAG antibodies and immunoblotted with the indicated antibodies. (E) Depletion of Cep152 has a modest effect on centriole duplication. Histograms represent the number of centrioles in mitosis treated with the indicated siRNAs. Values are mean percentages ± SD from three independent experiments (n = 30 for each experiment). (F) Beeswarm plots piled on boxplots represent the normalized signal intensity of Cep152 at the old mother centrioles upon the indicated siRNAs (n = 50). (G) HsSAS-6 was frequently absent from disengaged centrioles in the S phase. HeLa cells were treated with siControl or siCep57/Cep57L1 and immunostained with antibodies against HsSAS-6 (green), CP110 (red), and PCNA (cyan). (H) Histograms represent the frequency of the number of HsSAS-6 foci on the two pairs of centrioles (siControl) or four disengaged centrioles (siCep57/Cep57L1) in G. Values are mean percentages ± SD from three independent experiments (n = 30 for each experiment). (I) HsSAS-6 was normally recruited to the centrosomes at the onset of centriole formation in Cep57/Cep57L1-depleted cells. Histograms represent frequency of the lovastatin-arrested G1 phase cells with two HsSAS-6 foci. Values are mean percentages ± SD from three independent experiments (n = 30 for each experiment). The normal distribution of datasets was confirmed using the Kolmogorov–Smirnov test in F. Tukey’s multiple comparisons test was used in E and F to obtain the P values. A two-tailed, unpaired Student’s t test was used in I to obtain the P values. *, P < 0.05; **, P < 0.01; ***, P < 0.001; NS, P > 0.05. All scale bars, 5 µm in the low-magnification view, 1 µm in the inset.

