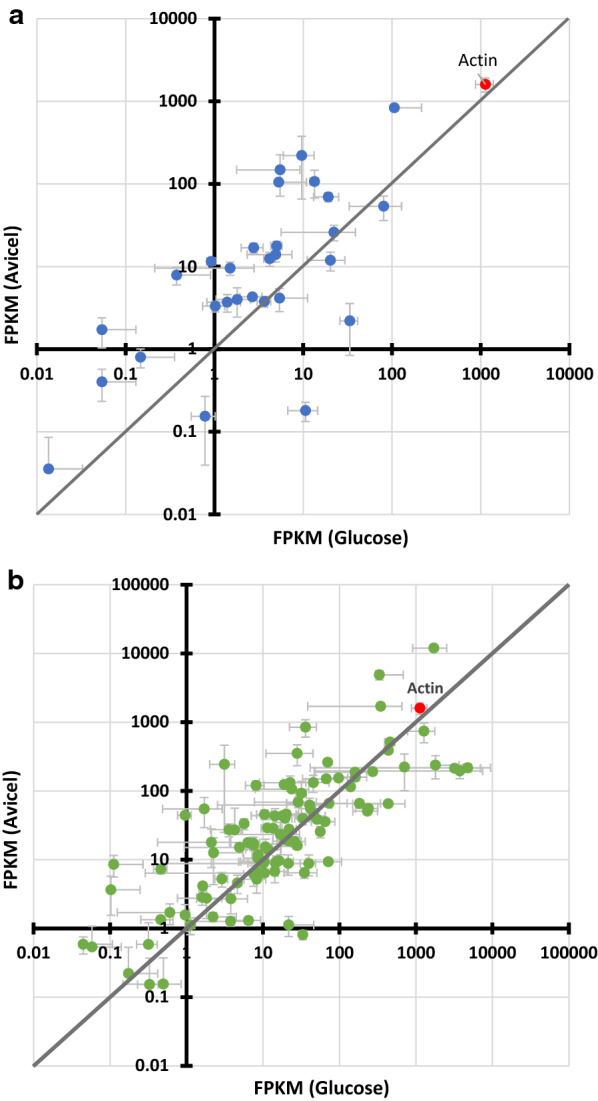
Fig. 3.

Expression level of transcripts of drug transporter genes in the presence of glucose and Avicel. a Scatter plot representing non-centred expression profile of ABC drug efflux pump genes in the presence of glucose and Avicel. 5 ABC transporter genes did not exhibit expression in either or both carbon sources and thus excluded from logarithmic plot. b Scatter plot representing non-centred expression profile of MFS drug efflux pump genes in the presence of glucose and Avicel. 11 MFS transporter genes did not exhibit expression in either or both carbon sources and thus excluded from logarithmic plot. The data represent average and standard deviation of two independent biological replicates
