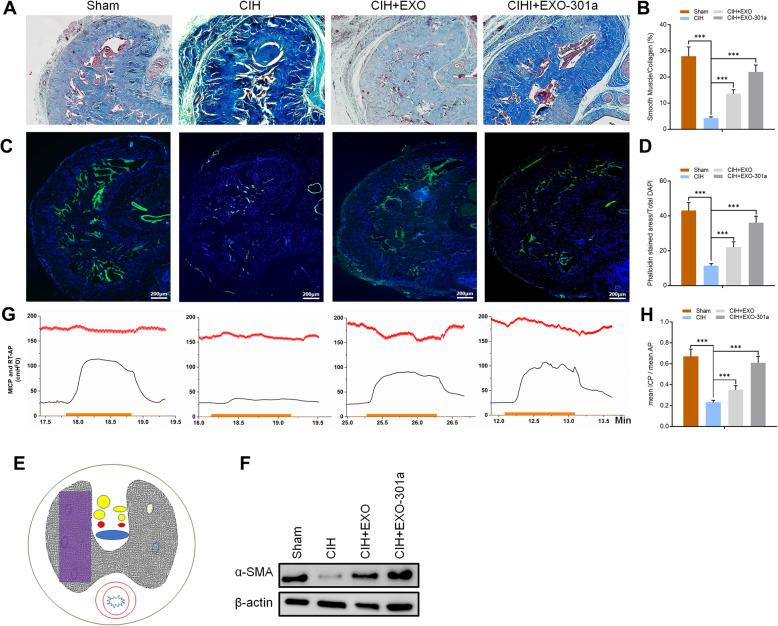
Fig. 2.
Rats were divided into 4 groups: sham, CIH exposure, CIH + exosomes from untreated ADSCs (Exo), and CIH + miR-301a-3p-enriched exosomes (Exo-301a). a, b Results of Masson trichrome staining for actin (red) and collagen (blue). c, d Results of Phalloidin (green) and DAPI (blue) staining in SD rats. e The purple rectangle denotes the area of the penis selected for an area for histology analysis. f Protein levels of α-SMA in sham, CIH, CIH+EXO, and CIH+EXO-301a groups as determined by Western blotting. g, h Results of ICP and RT-AP measurement in all four groups. The ICP is indicated with a green curve. The red curve denotes the real-time AP during electrostimulation. The orange bar denotes the 60-s cavernous nerve electrical stimulation. Data are expressed as mean ± SD (n = 6; ***p < 0.001)

