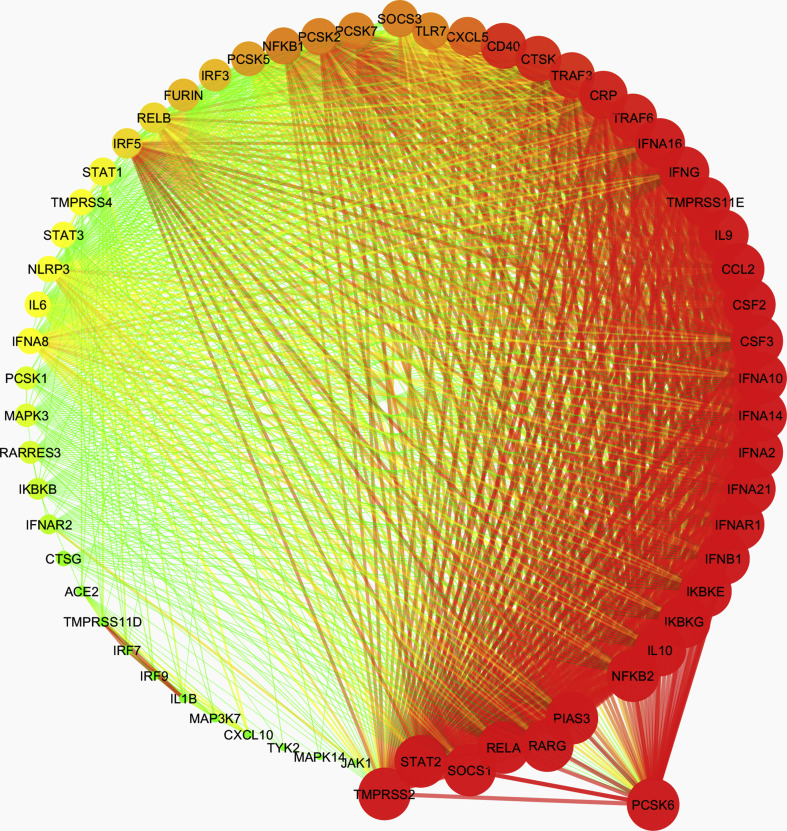
Supplementary Fig. 13.
The co-expression network in SARS-CoV-2, leukemia, psoriasis, pulmonary arterial hypertension, T2D Liver disease. The edge weight values > 0.05 for each node were filtered to obtain a meaningful interaction network and was drawn in Cytoscape. Dark color (Red - high, Orange - medium, Green - low) represents the degree of connection for each node, while color and width of the edges represent the interaction confidence (red and thick edge - high confidence; green and narrow edge - low confidence). The hub gene PCSK6 is highlighted by dragging.

