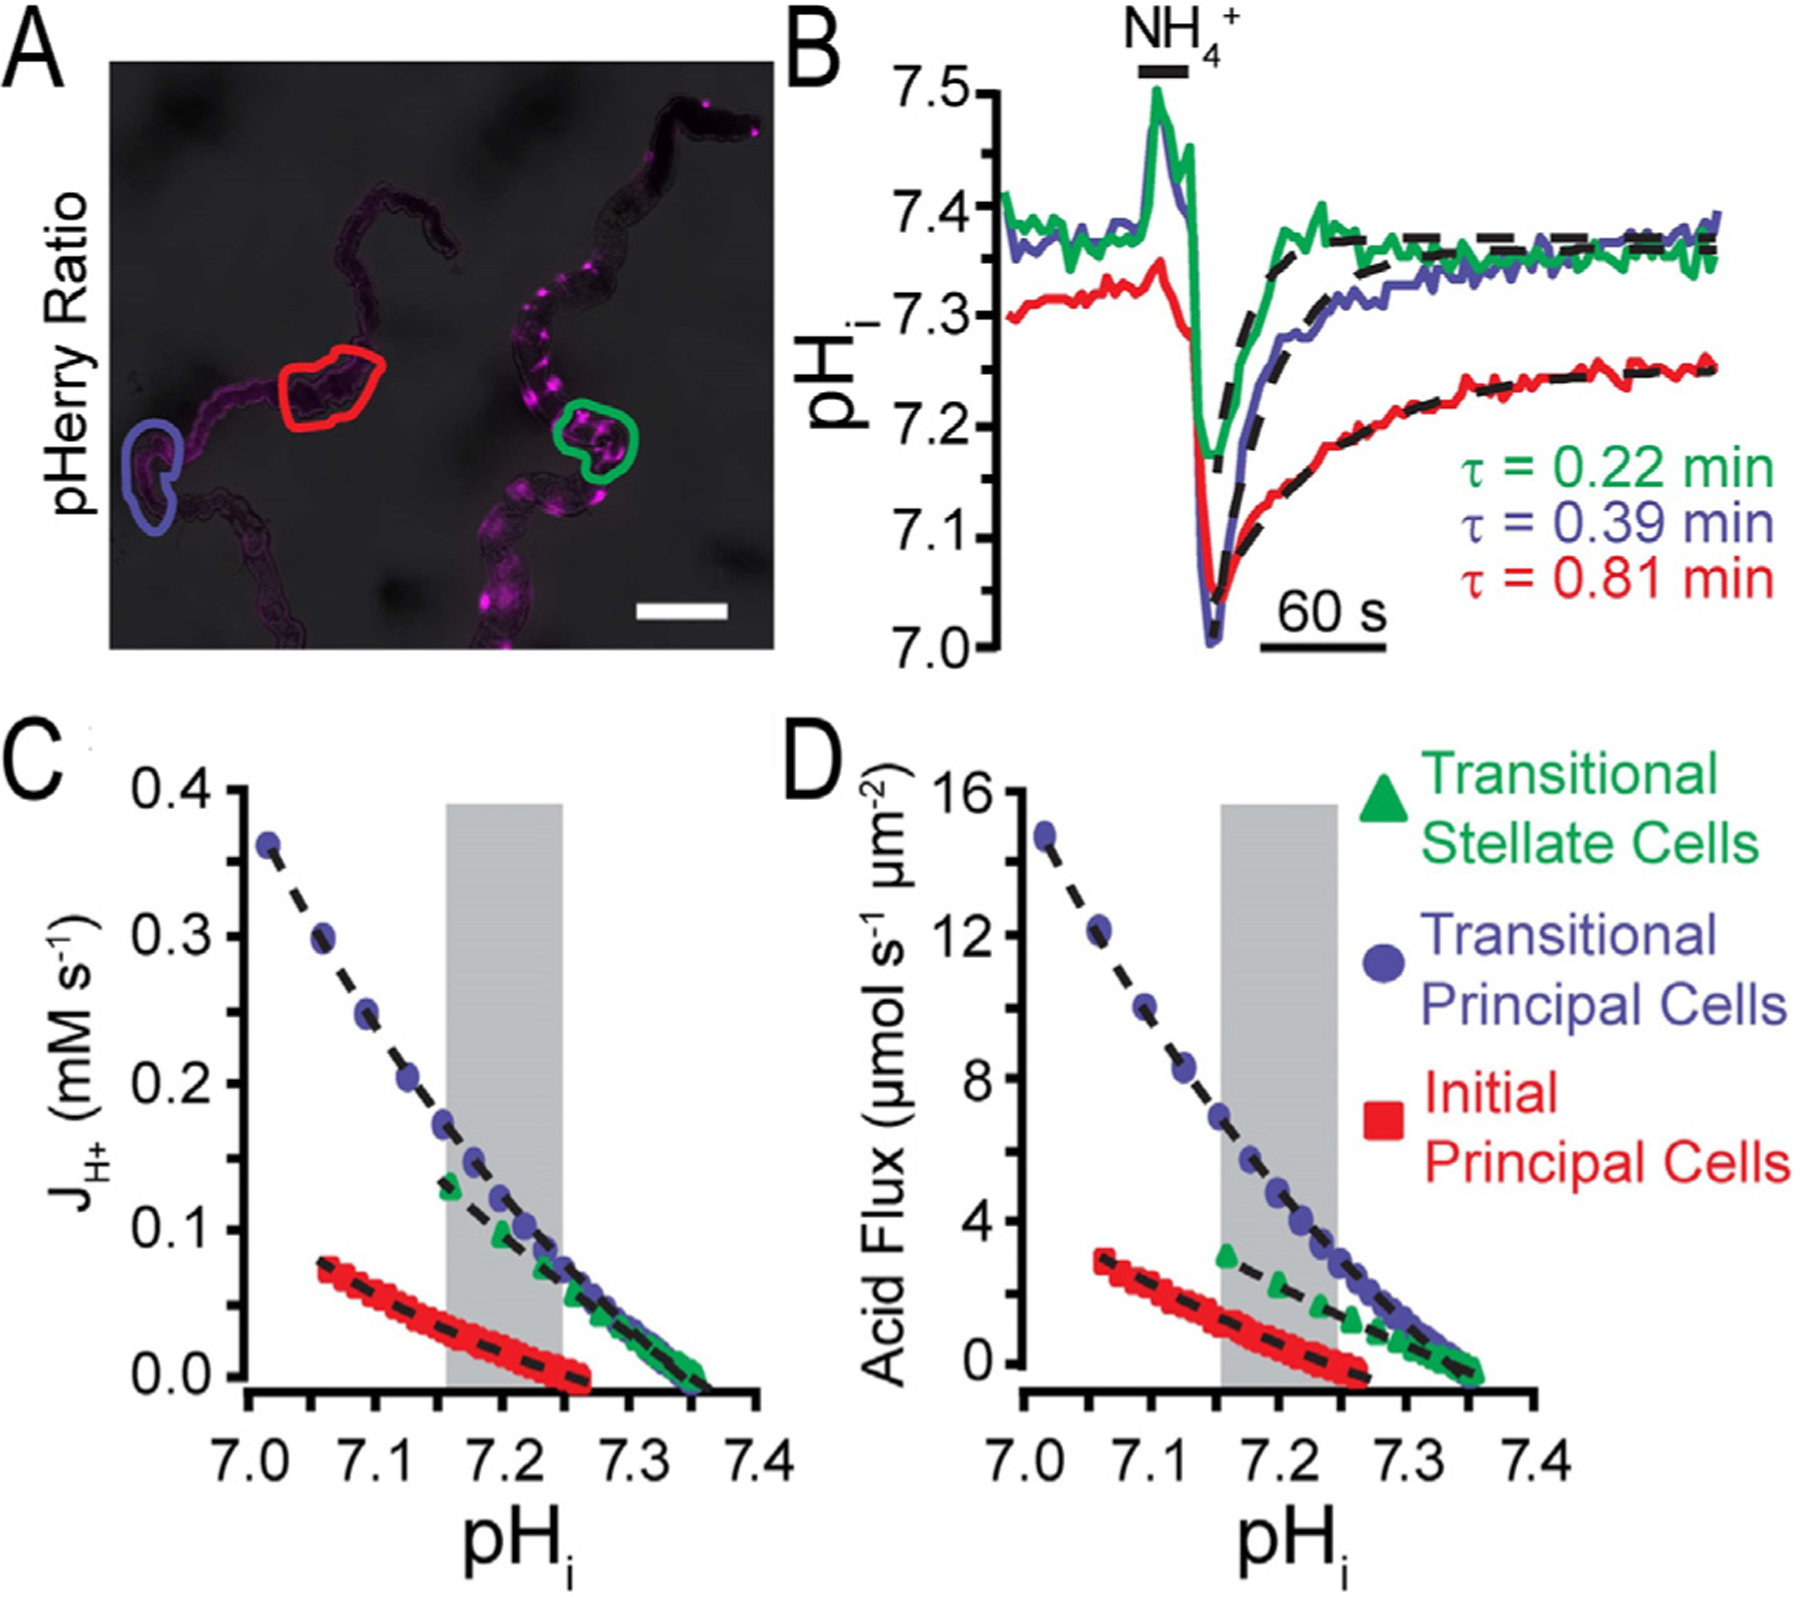
Figure 4.

Acid flux determined from pHerry responses to NH4Cl pulse. By using pHerry, its calibration, and the rates of recovery in selected regions, a quantification of acid flux may be calculated.103 (A) pHerry fluorescence ratio in anterior MTs: principal cells (left, driven by capaR-GAL4) and stellate cells (right, driven by c724-GAL4). Depending on MT location, stellate cells have different morphologies: cells in initial and transitional segments are bar-shaped and cells in the main segment have cellular projections. Scale bar = 100 μm. (B) pHi changes in response to 20 seconds of 40 mmol/L NH4Cl (in specific regions of A) are calibrated. Single exponential fits are shown as dashed curves in the acid recovery phase (withdrawal of NH4Cl solution). The numeric fit allows a decay constant (τ) value to be derived. (C) JH+ (acid extrusion rate or H+ flux) can be plotted against the calculated pHi. (D) JH+ (H+ flux) then may be transformed as a flux per unit area. Reprinted with permission from Rossano and Romero.103
