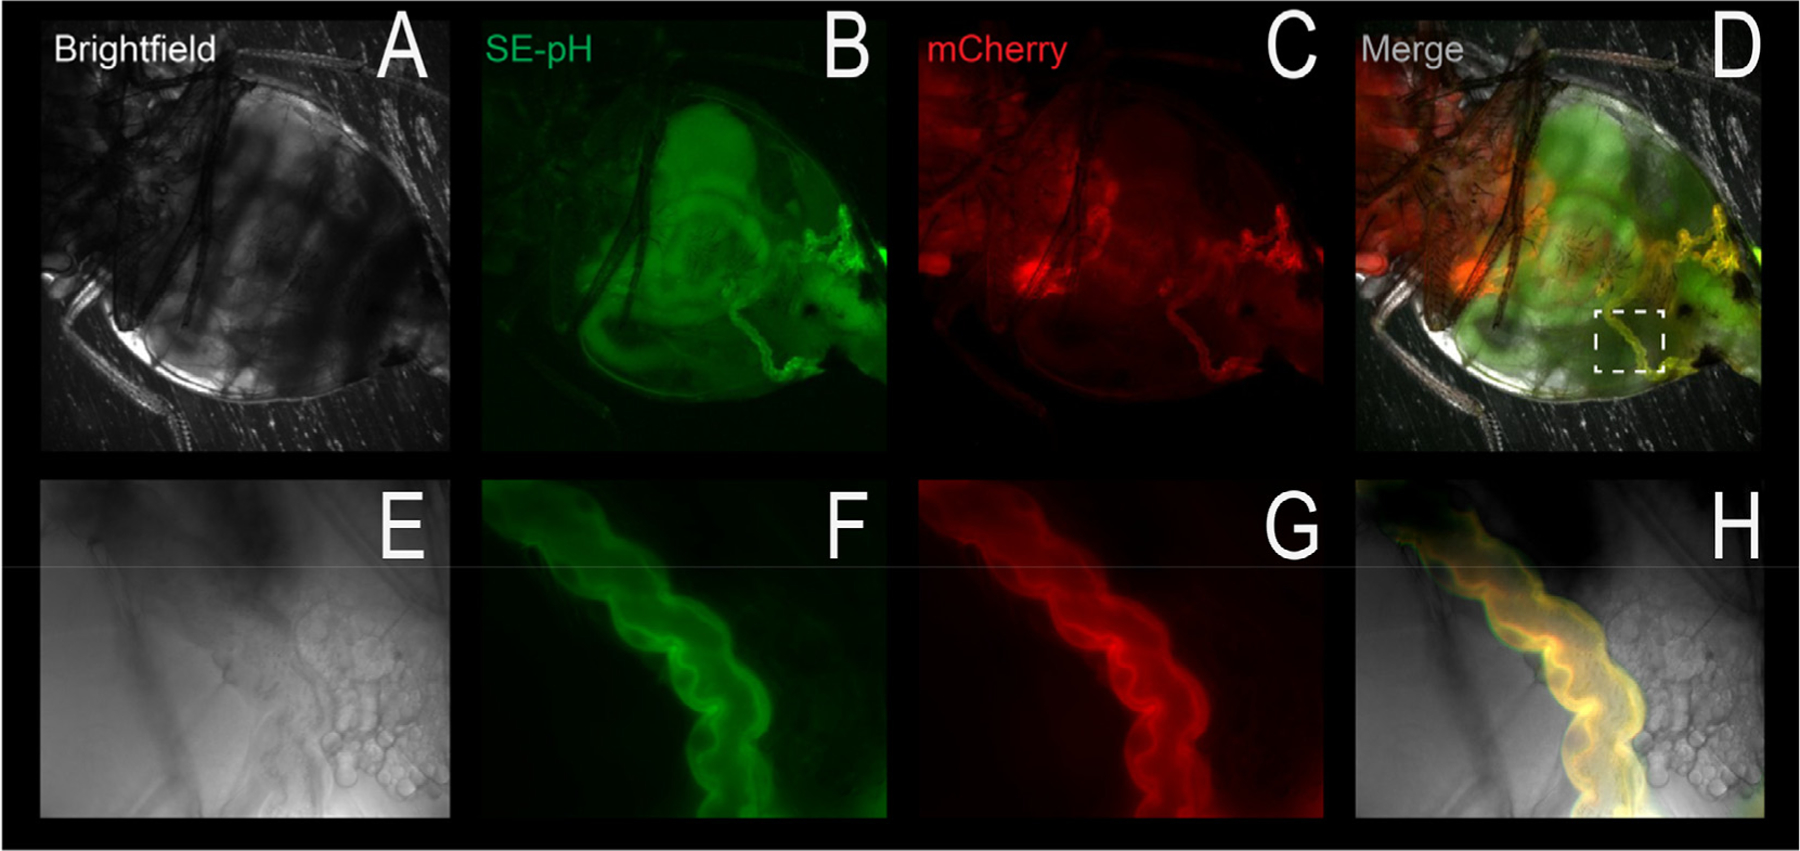
Figure 5.

In vivo pHerry fluorescence. The four panels show brightfield, super ecliptic pHluorin (SEpH) fluorescence, mCherry fluorescence, and a merge, respectively, of a living Drosophila. The top panels are a low magnification of the fly abdomen, which shows significant autofluorescence in the green and red channels. The dotted white box (merge panel) shows the Malpighian tubule (renal tubule epithelium, bottom images), which shows specific fluorescence, indicated by the yellow in the merged image. Note that these images were observed with the intact and anesthetized fly.
