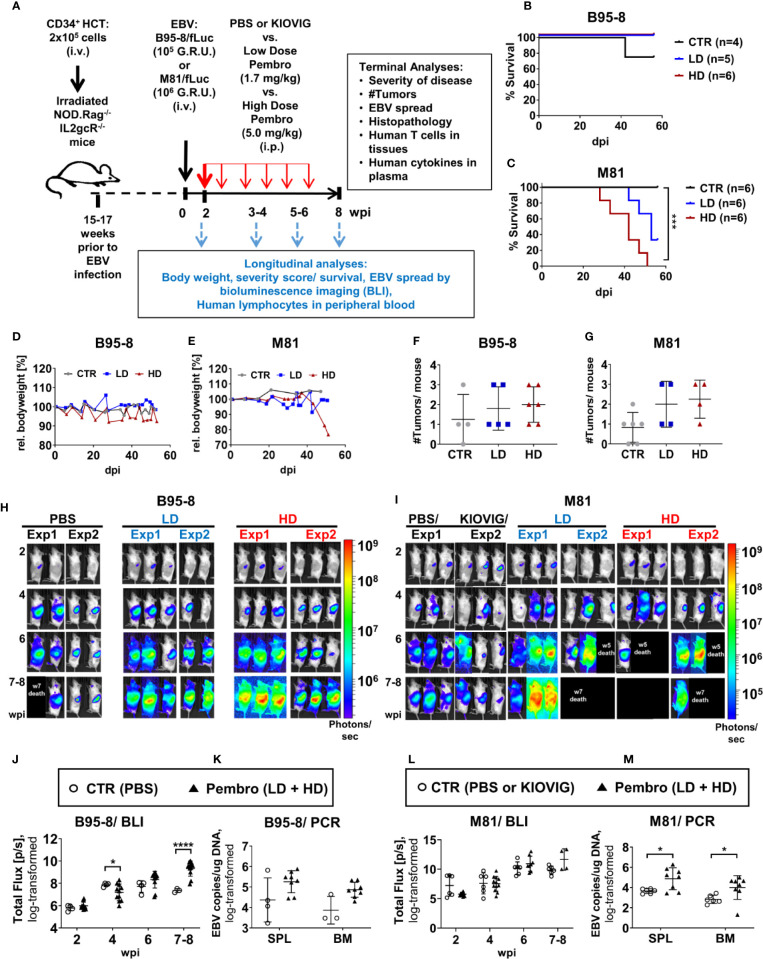
Figure 1.
Humanized mice infected with EBV/fLuc and treated with pembrolizumab show high mortality associated with increased EBV spread and tumor development. (A) Scheme of the experiments. 2 × 10⁵ human CD34+ cord blood (CB) purified hematopoietic stem cells (HSCs) were used for hematopoietic stem cell transplantation (HCT) of sub-lethally irradiated NRG mice. Fifteen to 17 weeks after HCT, the long-term human immune reconstitution in blood (huCD45+) was confirmed. At this point, mice were infected i.v., with the preferentially latent EBV B95-8/fLuc strain (105 GRU) or with the lytic EBV M81/fLuc strain (106 GRU). Two independent experiments using HSCs from two different CB donors were performed for each EBV model. At 2 weeks post-infections (wpi), bioluminescence imaging (BLI) analyses were performed to determine the baseline of EBV infection level and to randomize the mice among three cohorts: (i) injected i.p. with phosphate-buffered saline (PBS, corresponding to the control group, CTR), (ii) injected i.p. a low dose (LD: First administration 3.33 mg/kg at 2 wpi; 1.7 mg/kg every other week applied six times), or with (iii) a high dose (HD: First administration 10 mg/kg at 2 wpi; 5 mg/kg every other week applied six times). Mice were monitored for disease severity every 2–3 days and body weights were measured weekly. Scores of disease severity or loss of 20% of body weight were used as termination criteria. Optical imaging analyses and analyses of human immune reconstitution in peripheral blood collections were performed longitudinally (2, 4, 6, 8 wpi). The experimental endpoint was eight weeks post-infections. The following data was acquired for terminal analyses: % survival, occurrence of weight loss, occurrence of tumors, EBV load, histopathology, characterization of T cells in blood and tissues, human cytokine profile in plasma. (B, C) Survival curves for humanized mice infected with the B95-8/fLuc strain (B) or with the M81/fLuc strain (C). A log-rank test (Mantel-Cox) was applied to evaluate the differences in survival. Cohorts: CTR (gray line), LD (blue line); HD (red line). (D, E) Measurements of body weight relative to the baseline weights on the day of EBV infection. Mice infected with B95-8/fLuc strain (D) or M81/fLuc strain (E). Cohorts: CTR (grea line), LD (blue line); HD (red line). (F, G) Numbers of macroscopically detectable tumors in mice infected with B95-8/fLuc (F) or with M81/fLuc (G). Cohorts: CTR (gray dots), LD (blue dots); HD (red dots). (H, I) BLI pictures generated sequentially from week 2 to 8 after EBV infection performed in duplicate experiments for each EBV model and treatment. Pictures were taken of left body side of mice infected with B95-8/fLuc (H) or with M81/fLuc (I). Bioluminescence signal intensities (photons/sec) are depicted by the color bars on the right side. Black boxes depict dead mice. (J–L) Quantification of EBV spread by BLI for the B95-8/fLuc (J) or M81/fLuc (L) strain. Total Flux corresponds to the radiance (photons/sec) in each pixel summed over the regions of interest (ROI) area containing the whole left side of the body. The dots represent quantifications at 2, 4, 6, 8 wpi for each mouse in CTR (open circles) or in pembrolizumab treatment cohorts (filled triangles, LD and HD were combined). (K–M) Quantification of EBV spread by RT-qPCR. EBV copies per µg DNA were quantified in spleen (SPL) and bone marrow (BM) of mice infected with B95-8/fLuc (K) or with M81/fLuc (M). The dots represent quantifications for each mouse in CTR (open circles, PBS and KIOVIG controls combined) or in pembrolizumab treatment cohort (filled triangles, LD and HD were combined). Results of measurements were log-transformed and statistical analyses were performed using unpaired t test with Welch’s correction. Standard deviation is indicated. Statistical significances are indicated with *P < 0.05, ****P < 0.0001.

