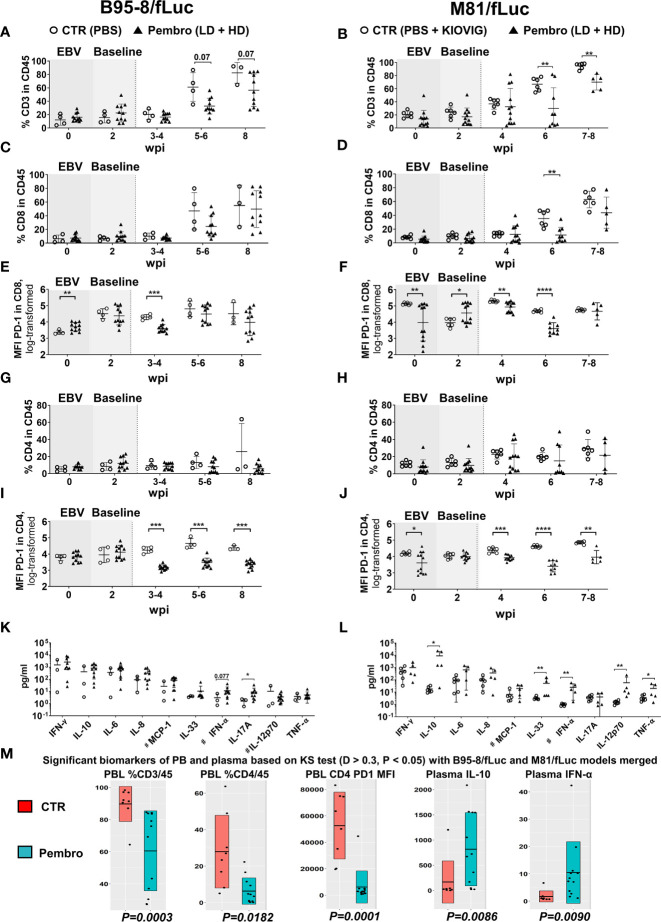
Figure 4.
Reduced frequencies of human T lymphocytes in peripheral blood and increased concentrations of human cytokines in plasma after PD-1 blockade during active EBV infections. Peripheral blood was collected on the day prior to EBV infection (time-point 0) and 2 weeks post-infections (wpi), as baseline values for randomization (shaded graphs). Non-treated control mice (CTR, open circles) and pembrolizumab treated cohorts are shown (filled triangles; low-dose and high-dose treatments were merged for the analyses, each dot represents a mouse analyzed at the corresponding time point). After initiation of pembrolizumab treatment, peripheral blood was collected at 3–4, 5–6, and 8 wpi. The different EBV infection models (B95-8/fLuc; left panels and M81/fLuc; right panels) were analyzed separately regarding lymphocytes and cytokines and then the data was merged for power analyses and identification of markers associated with response. (A–J) Flow cytometry analyses of peripheral blood lymphocytes. (A, B) Frequencies (%) of human CD45+/CD3+ lymphocytes were reduced after pembrolizumab treatment. (C, D) Frequencies (%) of human CD45+/CD8+ lymphocytes were reduced after pembrolizumab treatment. (E, F) Mean fluorescence intensities (MFI) of PD-1 detected on the surface of CD8+ T cells were reduced after pembrolizumab treatment. (G, H) Frequencies (%) of human CD45+/CD4+ lymphocytes were reduced after pembrolizumab treatment. (I, J) MFI of PD-1 detected on the surface of CD4+ T cells were significantly reduced after pembrolizumab treatment. Statistical analyses for flow cytometry data was performed using unpaired t test with Welch’s correction. Standard deviation is indicated. *P < 0.05, **P < 0.01, ***P < 0.001, ****P < 0.0001. (K, L) Concentration human cytokines (pg/ml) at 8 wpi showing elevation for several cytokines in plasma of mice infected B95-8/fLuc (K) or M81/fLuc (L) treated with pembrolizumab. Mann-Whitney t test was used to compare the control and treatment groups. Standard deviation is indicated. *P < 0.05, **P < 0.01. # indicates parameters with some values being beyond the lower limit of detection (LOD), LOD was used for these samples to analyze the differences. (M) Global analysis for power analyses and identification of T cell and cytokine patterns at 8 wpi. The datasets from the B95-8/fLuc and M81/fLuc infection models were merged. Kolmogorov-Smirnov-Test (KS test; D > 0.3, P < 0.05) is depicted for flow cytometry and cytokine datasets showing markers with significant difference between control (CTR, red) and pembrolizumab treatment (Pembro, blue). P-values determined for each biomarker are indicated below the box plots. The top biomarkers associated with pembrolizumab treatment were: Reduced %CD3/CD45 (P = 0.0003), reduced %CD4/CD45 (P = 0.0182), reduced MFI of PD-1 expression on CD4+ cells (P = 0.0001), increased IL-10 (P = 0.0086) and IFN-α (P = 0.0090) levels in plasma.

