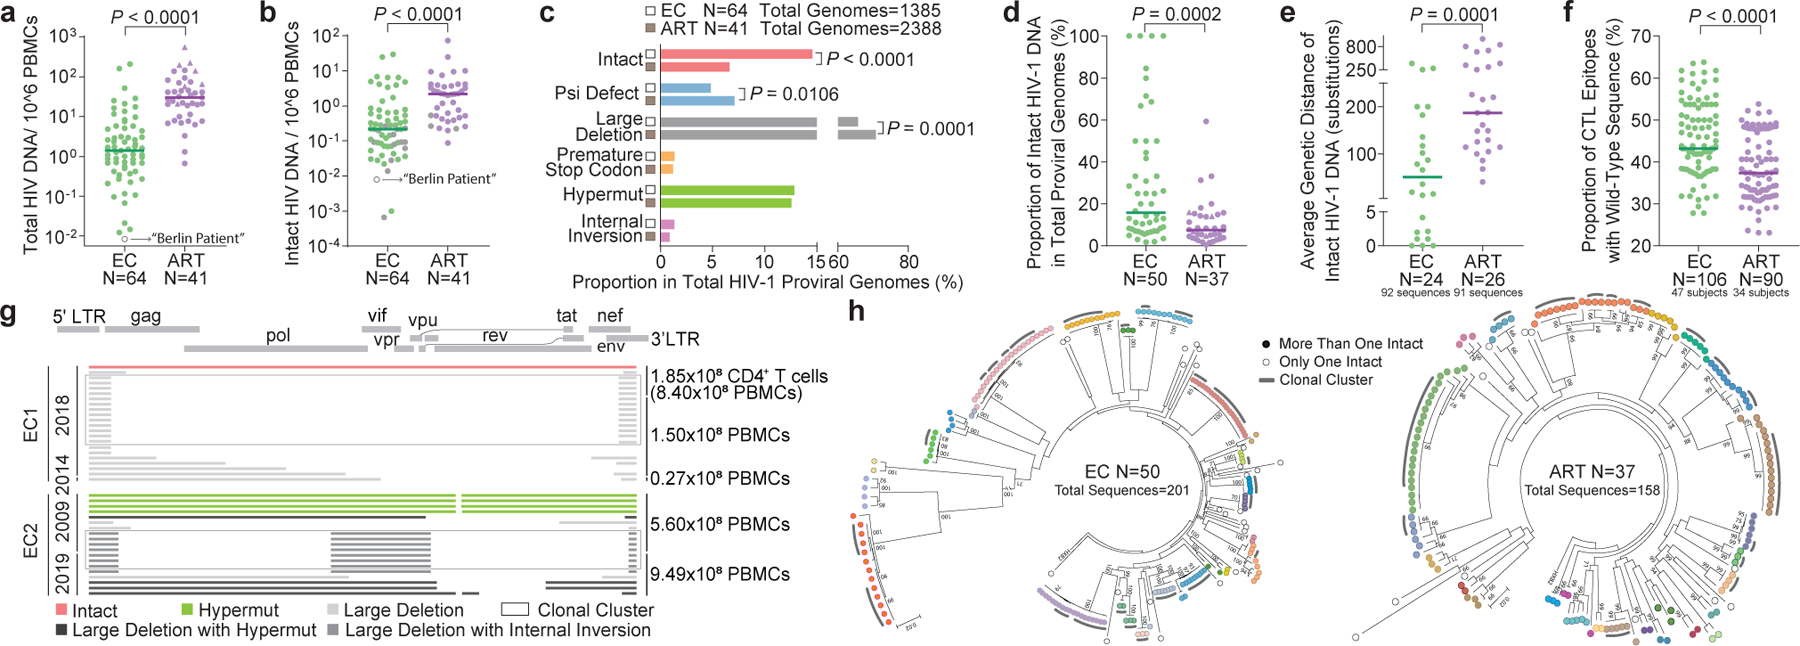
Figure 1: Proviral reservoir landscape in HIV-1 ECs.

(a-b): Relative frequencies of total (a) and near full-length intact (b) HIV-1 DNA sequences in ECs and ART-treated individuals (ART). Grey symbols: Limit of detection (expressed as 1 copy/total number of analyzed cells without target identification). Circles: Proviral sequences obtained from unfractionated PBMC; triangles: proviral sequences retrieved from isolated CD4+ T-cells and normalized to PBMC. (c): Proportions of proviral sequences that are genome-intact or display defined structural defects among all proviral genomes. (d): Proportion of IPs among all proviral genomes from each study participant. Only individuals with at least one detected IP are shown. (e): Average genetic distance between distinct IPs obtained from each study participant. Participants with at least two detectable IPs are included. (f): Proportion of optimal CTL epitopes (restricted by autologous HLA class I isotypes) with wild-type clade B consensus sequences. Each dot represents one IP. Clonal sequences are counted once. (g): Diagrams reflecting all proviral HIV-1 sequences isolated from EC1 and EC2. Left vertical axis: Dates of sample collection; right vertical axis: Numbers of cells analyzed. (h): Circular maximum-likelihood phylogenetic trees for all IPs from ECs and ART-treated individuals. Dots with the same colors indicate IPs detected in the same individuals. Clonal sequences, defined by complete sequence identity, are indicated by grey arches. Bootstrap analysis with 1000 replicates was performed to assign confidence to tree nodes; bootstrap support values >70% are shown in the trees. Two-tailed Mann Whitney U tests were used for panels a-b, d-f; False Discovery Rate (FDR)-adjusted two-tailed Fisher’s exact tests were used for panel c.
