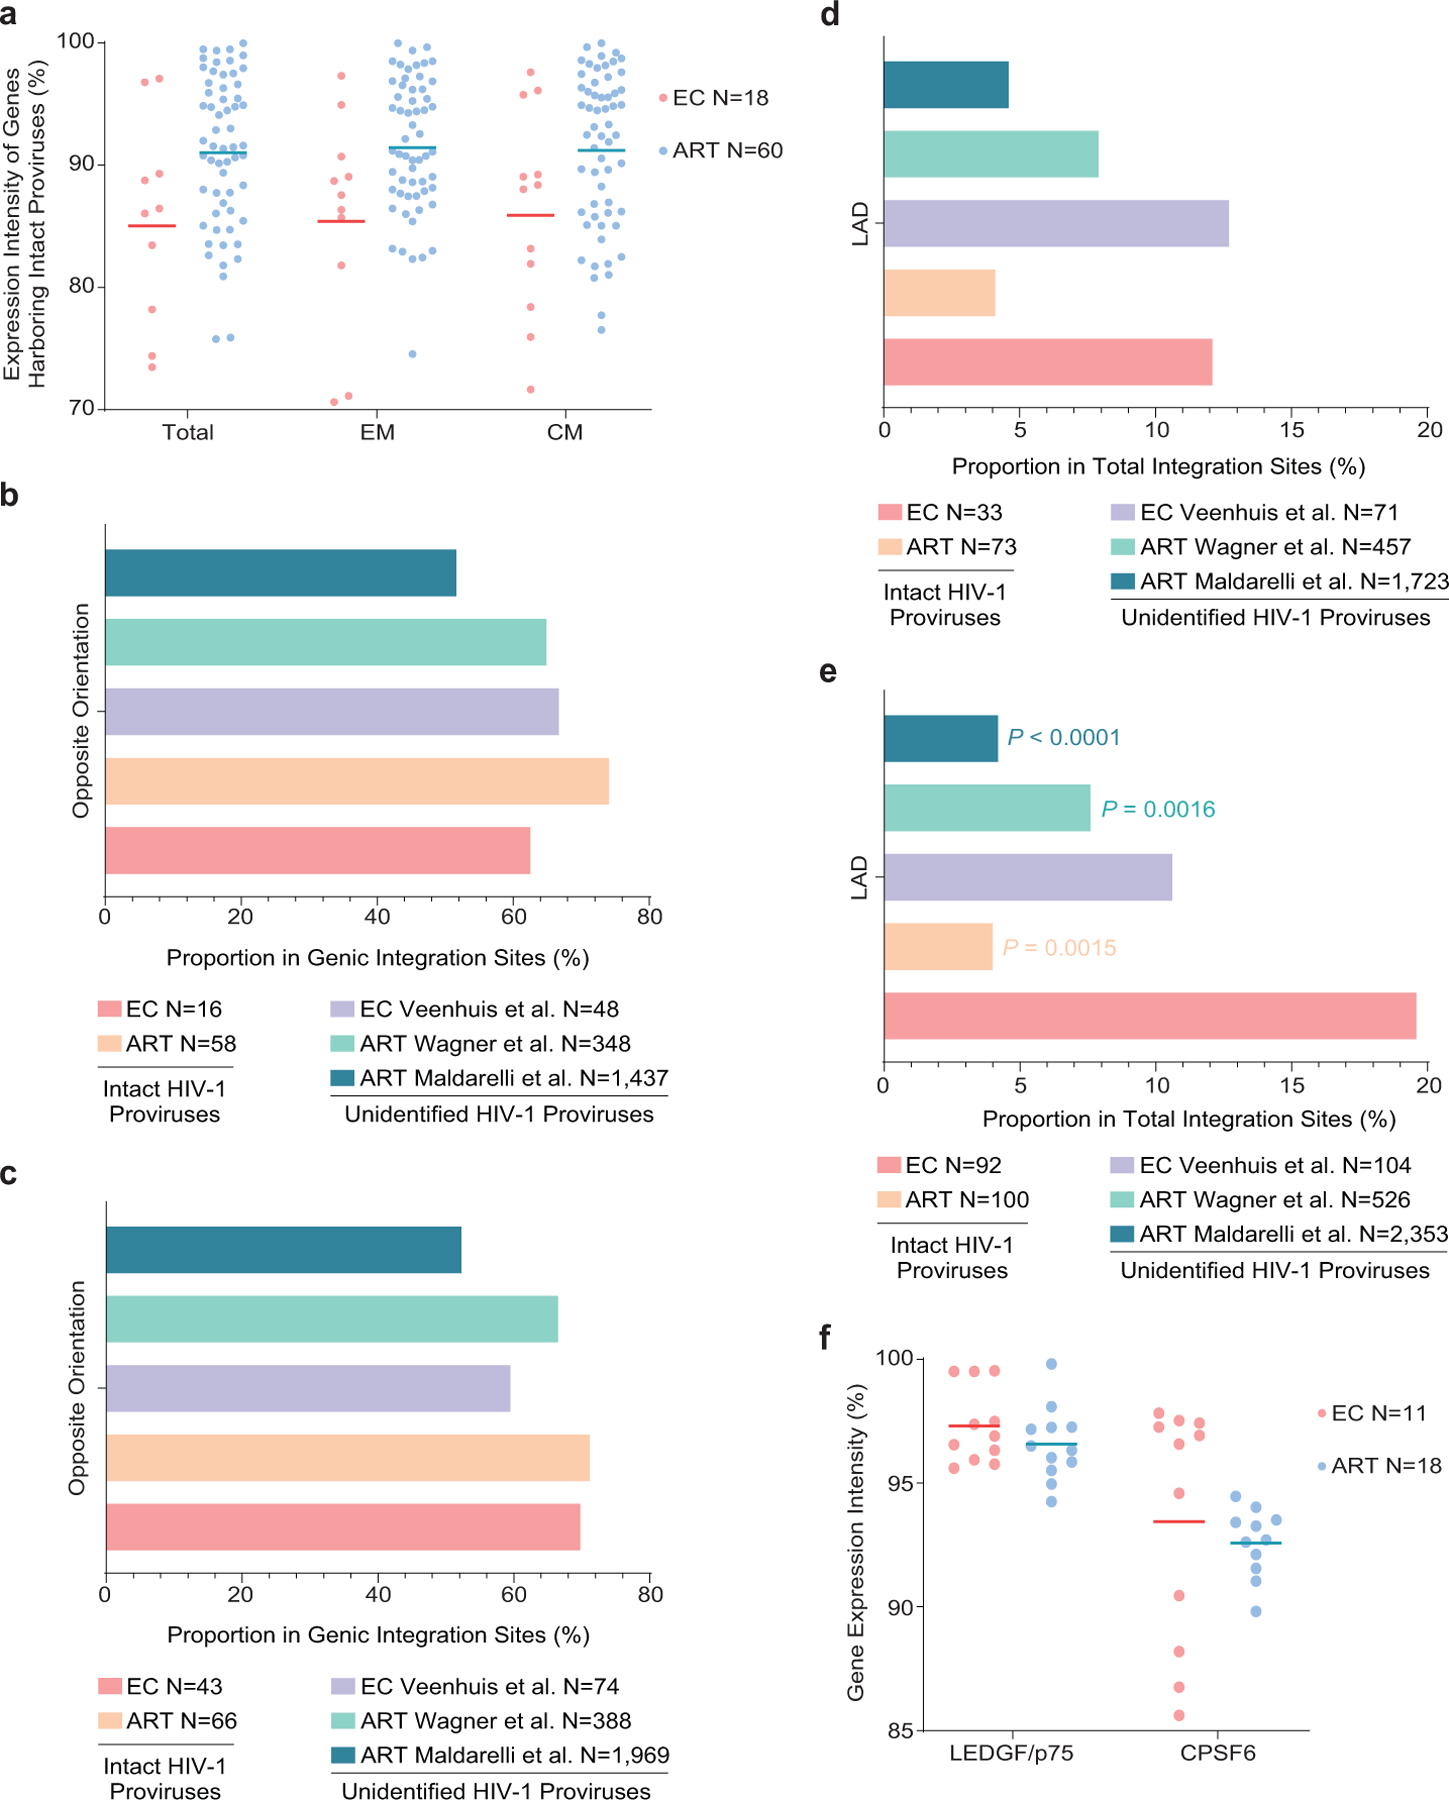
Extended Data Figure 7: Accessory chromosomal integration site features of intact proviral sequences from ECs.

(a): Expression of host genes harboring intact proviral sequences in ECs and long-term ART-treated individuals, as determined by autologous RNA-Seq data in total, central-memory (CM) and effector-memory (EM) CD4+ T-cells. Gene expression percentiles are indicated. (b-c): Orientation of intact proviruses relative to host genes in ECs and long-term ART-treated individuals. All data for genic integration sites with exclusive orientation towards host genes are included. Integration site data from prior studies involving ECs (Veenhuis et al.7) and ART-treated individuals (Maldarelli et al.16, Wagner et al.14) are shown for comparative purposes. (d-e): Proportion of intact proviruses from ECs and long-term ART-treated individuals in lamina-associated domains (LAD), determined using Lamin B1-DNA adenine methyltransferase Identification (DamID) by Robson et al.60 for resting Jurkat cells. Integration site data from prior studies involving ECs (Veenhuis et al.7) and ART-treated individuals (Maldarelli et al.16, Wagner et al.14) are shown for comparative purposes. (b, d): Clonal proviruses were counted once; (c, e): clonal proviruses were counted as individual sequences (FDR-adjusted two-sided Fisher’s exact tests). (f): Expression of LEDGF/p75 and CPSF6 mRNA in autologous total CD4+ T-cells from ECs and long-term ART-treated individuals, as determined by RNA-Seq. Gene expression percentiles are indicated. (a, f): Horizontal lines reflect the geometric mean. All comparisons were made between ECs and reference groups.
