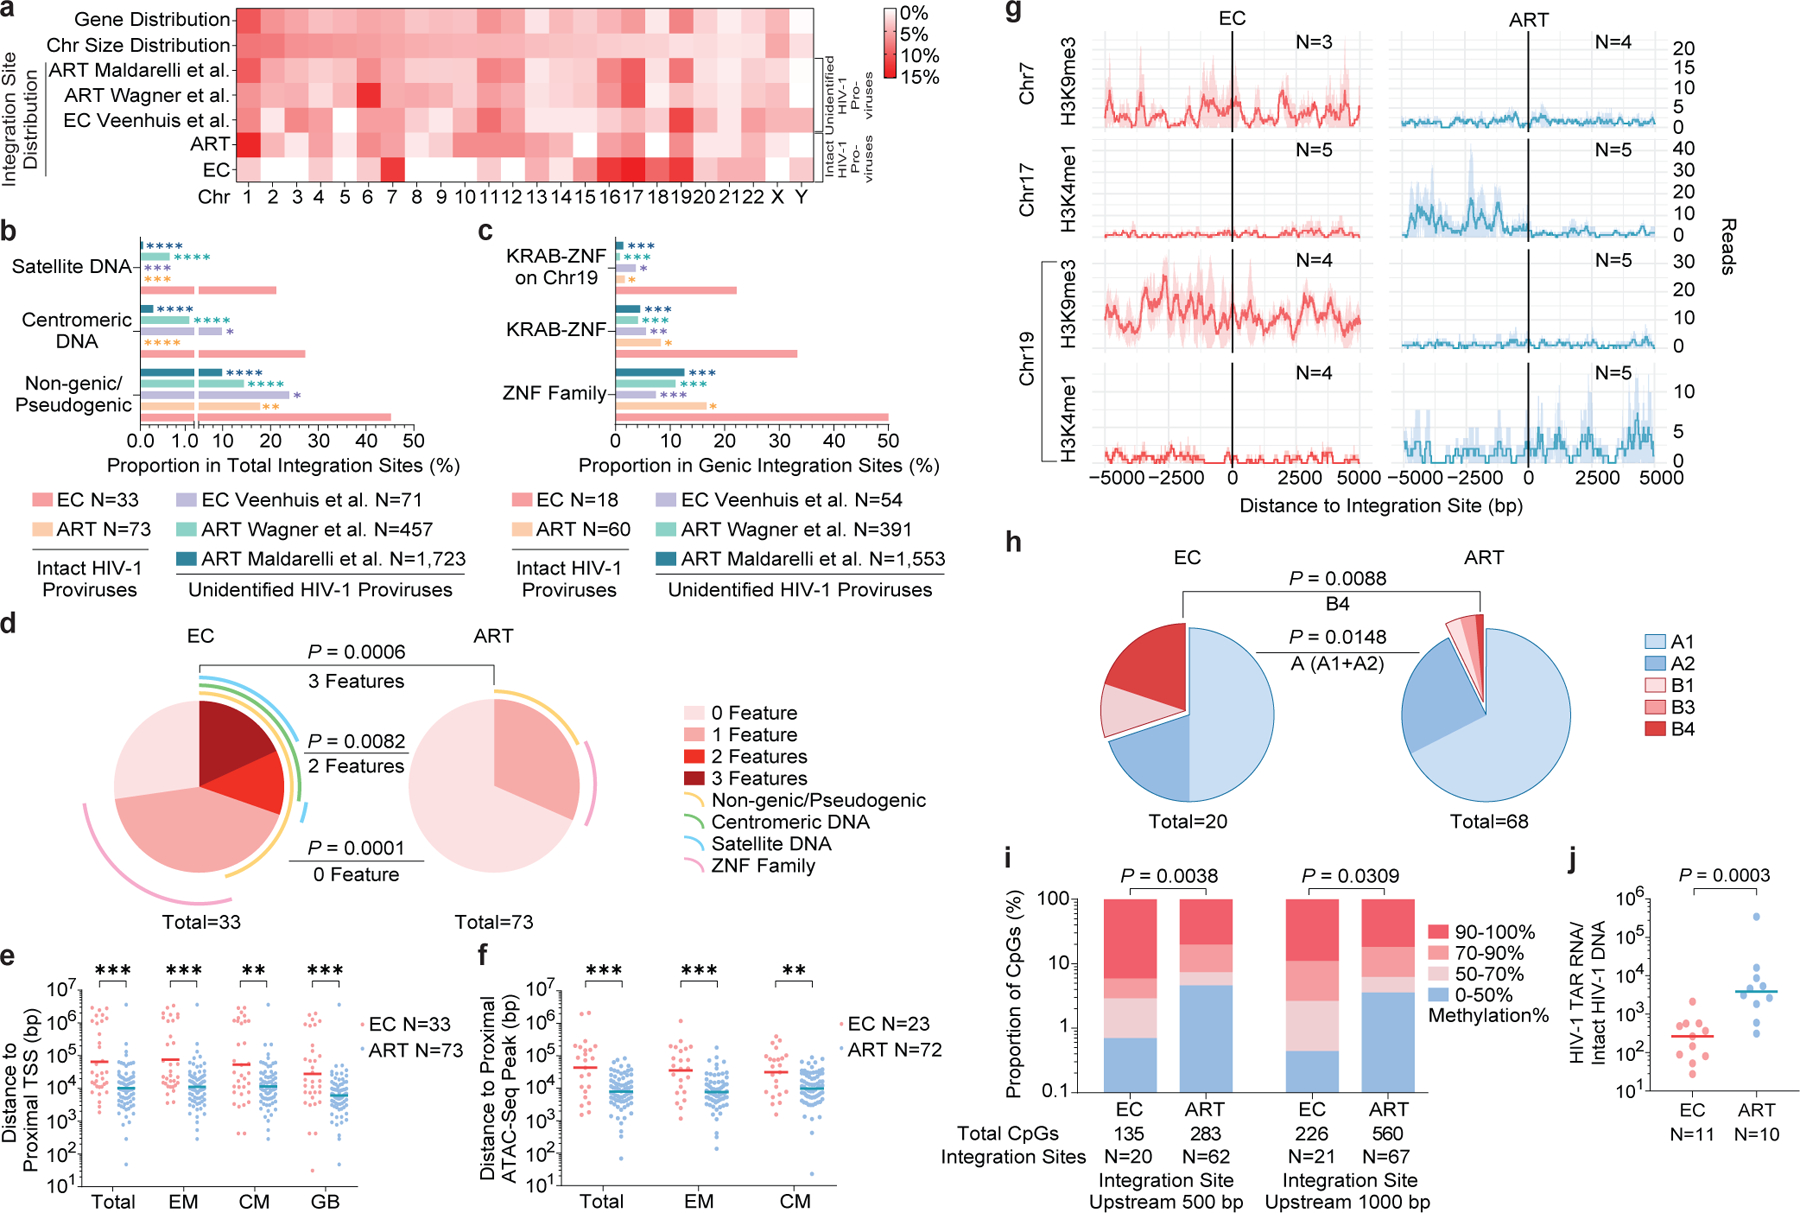
Figure 4: Distinct genomic and epigenetic features of IS of IPs from ECs.

(a): Relative proportion of proviral IS of IPs in each chromosome. Contributions of each chromosome to total number of genes (first row) and to total size of human genome (second row) are included as references. (b-c): Proportion of IPs located in indicated genomic regions. (a-c): Data from IPs in ART-treated individuals13 (ART) and from unselected (intact and defective) proviral sequences in ECs7 and in ART-treated individuals14,16 are shown as references. (d): SPICE diagrams demonstrating proportions of IPs with indicated IS features in ECs and ART-treated individuals. (e-f): Chromosomal distance between IS of IPs and the most proximal TSS in autologous total, EM or CM CD4+ T-cells or from Genome Browser (GB) (e), or to the most proximal ATAC-Seq peaks (f) in autologous total, EM and CM CD4+ T-cells. Horizontal lines reflect the geometric mean. (g): Numbers of DNA sequencing reads associated with activating (H3K4me1) or repressive (H3K9me3) histone protein modifications in proximity to IS from ECs and long-term ART-treated individuals13; median and confidence intervals (one standard deviation) of ChIP-Seq data from primary memory CD4+ T-cells included in the ROADMAP repository25 are shown. (h): Proportions of IPs located in structural compartment A and B (and associated sub-compartments), as determined by Hi-C-Seq data28. IS in regions not covered in ref.28 were excluded. (i): Numbers of cytosine residues with indicated levels of methylation (derived from CD4+ T-cells in the iMethyl database30) in proximity (500 or 1000 bp upstream of the 5’ LTR host-viral junction) to IS from ECs and ART-treated individuals. (j): Frequencies of HIV-1 RNA transcripts in PBMC from ECs and ART-treated individuals, normalized to the corresponding number of IPs determined by FLIP-Seq. (a-i): Clonal sequences were only counted once. (f-i): Sequences in genomic regions included in the ENCODE blacklist27 were excluded. ****p<0.0001, ***p<0.001, **p<0.01, *p<0.05; (b/c/d/h): two-sided Fisher’s exact tests; (e/f/j): two-sided Mann Whitney U tests; (i): two-tailed Chi-square test; (b/c/e/f/i): FDR-adjusted p-values; (d/h/j): nominal p-values. All comparisons were made between ECs and reference groups.
