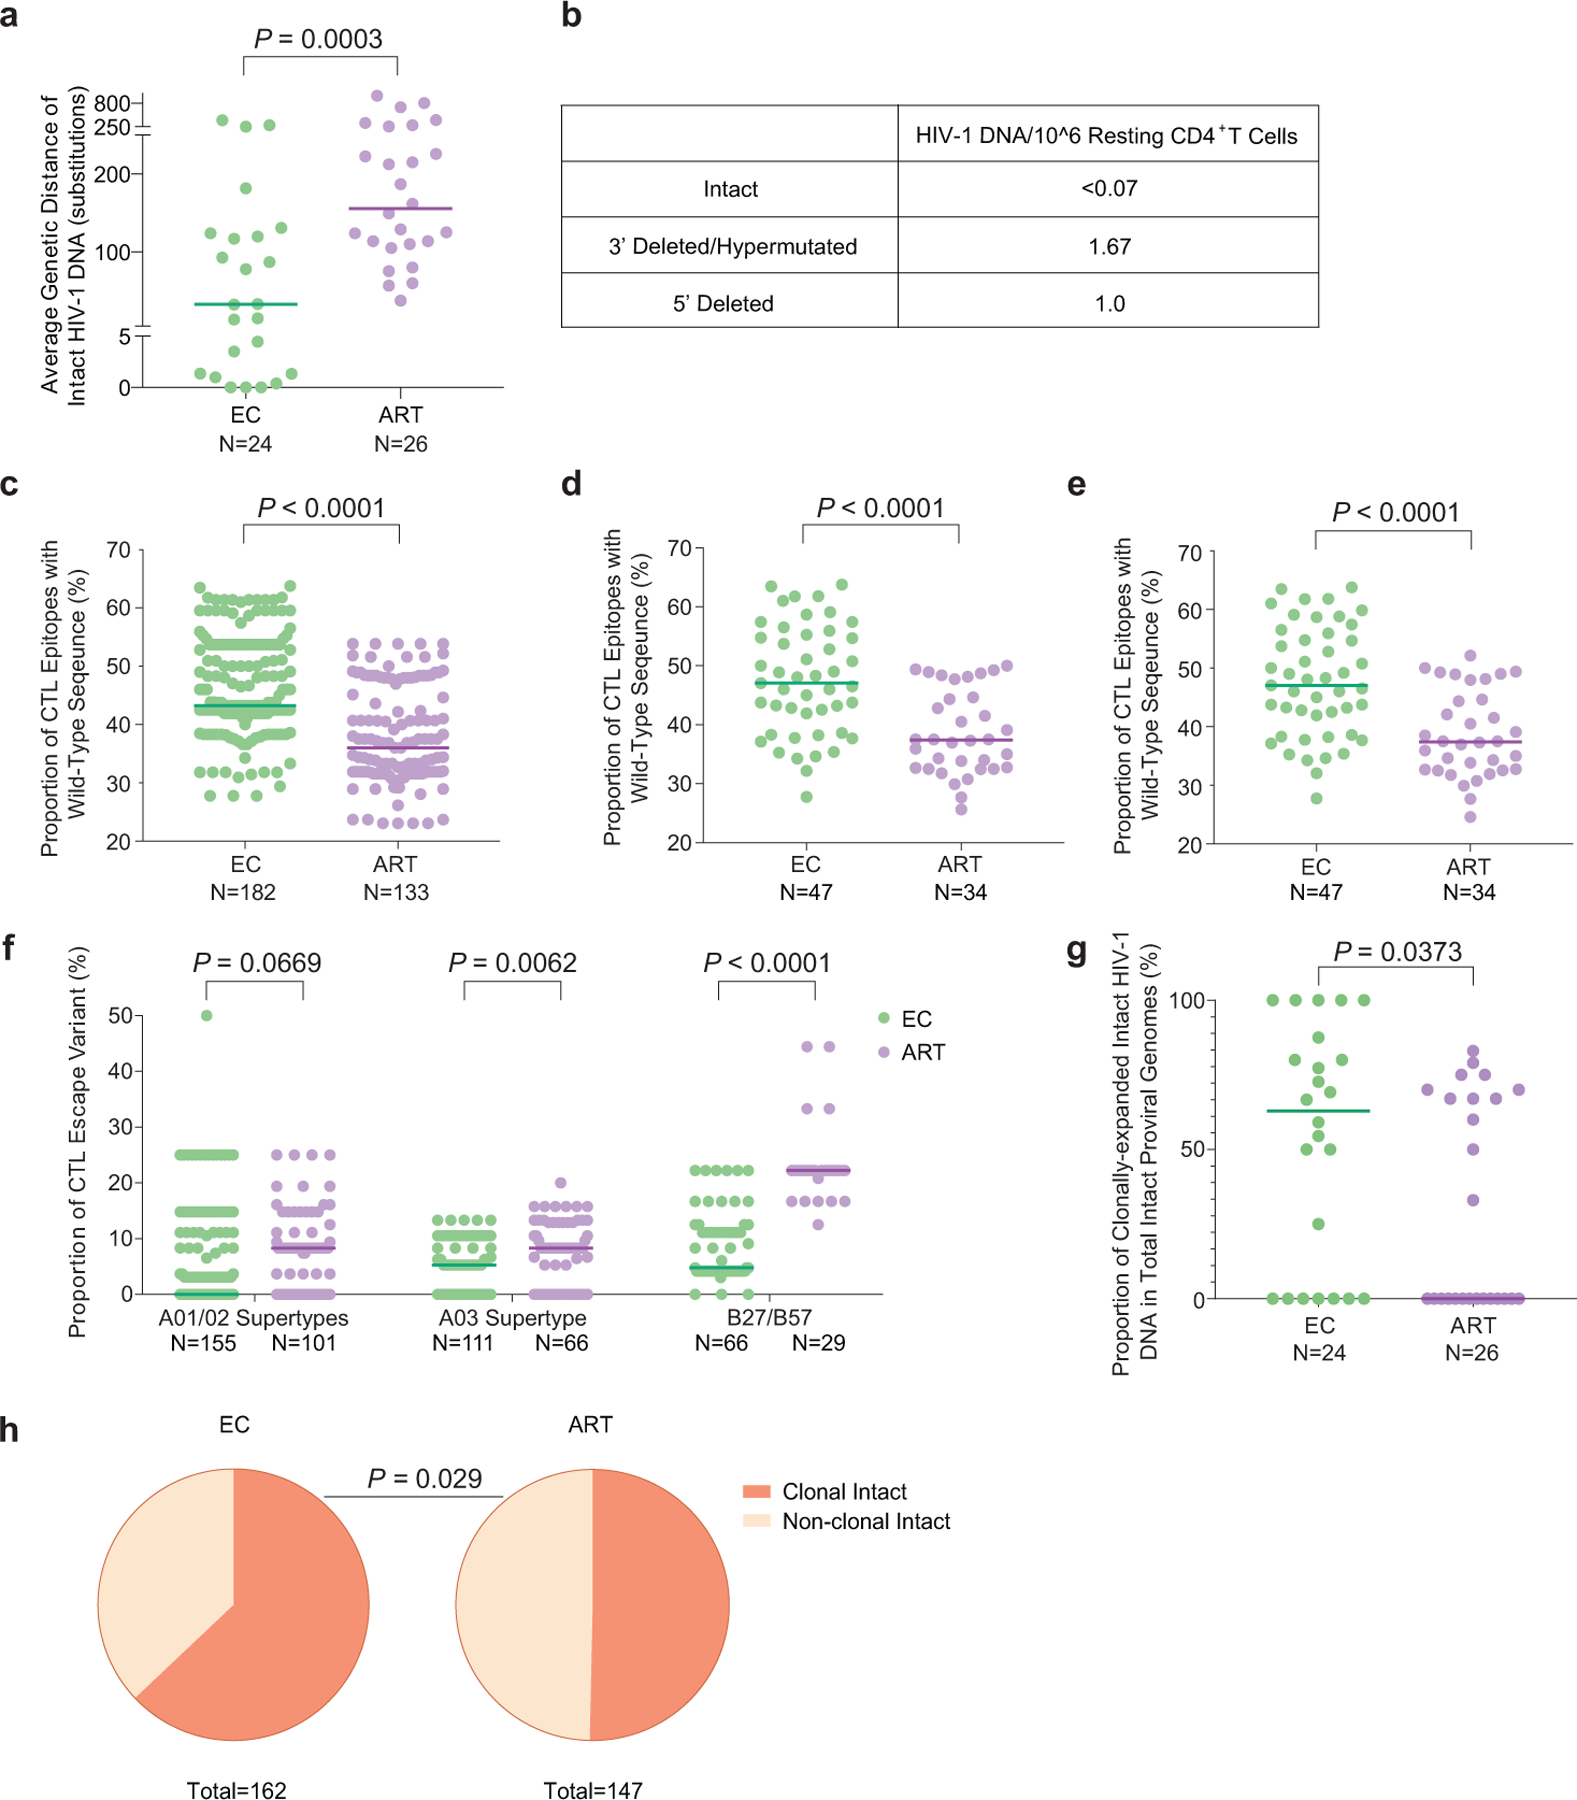
Extended Data Figure 1: Viral sequence analysis of intact HIV-1 proviruses from ECs.

(a): Genetic distance (expressed as average number of base pair substitutions) among all intact near full-length proviral sequences obtained from each study participant. Clonal sequences were considered as individual sequences; participants with at least two intact proviruses are included (n=175 intact proviral sequences from 24 ECs and n=147 intact proviral sequences from 26 ART-treated individuals). (b): Frequencies of proviral species (copies per million resting CD4+ T-cells) detected by IPDA from EC2. (c): Proportion of optimal CTL epitopes (restricted by autologous HLA class I isotypes) with wild-type sequences. Each dot represents one intact proviral sequence. N=182 and N=133 HIV-1 clade B intact sequences from 47 ECs and 34 ART-treated individuals are included, respectively. Optimal CTL epitopes matching the clade B consensus sequences were considered as wild-type sequences. Clonal sequences were considered as individual sequences. (d-e): Average frequencies of autologous HLA-restricted optimal CTL epitopes with wild-type sequences calculated from intact proviruses in each study participant. Clonally-expanded sequences were counted either once (d) or individually (e). Each dot represents one study participant. (f): Proportion of CTL escape variants (restricted by HLA-A01/A02 supertypes, HLA-A03 supertype, or HLA-B*27/B*57). Each dot represents one intact proviral sequence. Clonal sequences were counted individually. (g-h): Proportion of clonal intact proviruses among all intact proviruses within each study participant (g) or within all intact proviruses from ECs and ART-treated individuals(h). Study participants in whom at least two intact proviruses were detected are included in (g) and (h). (Two-tailed Mann Whitney U tests were used for panels a, c-g; two-sided Fisher’s exact test was used for panel h).
