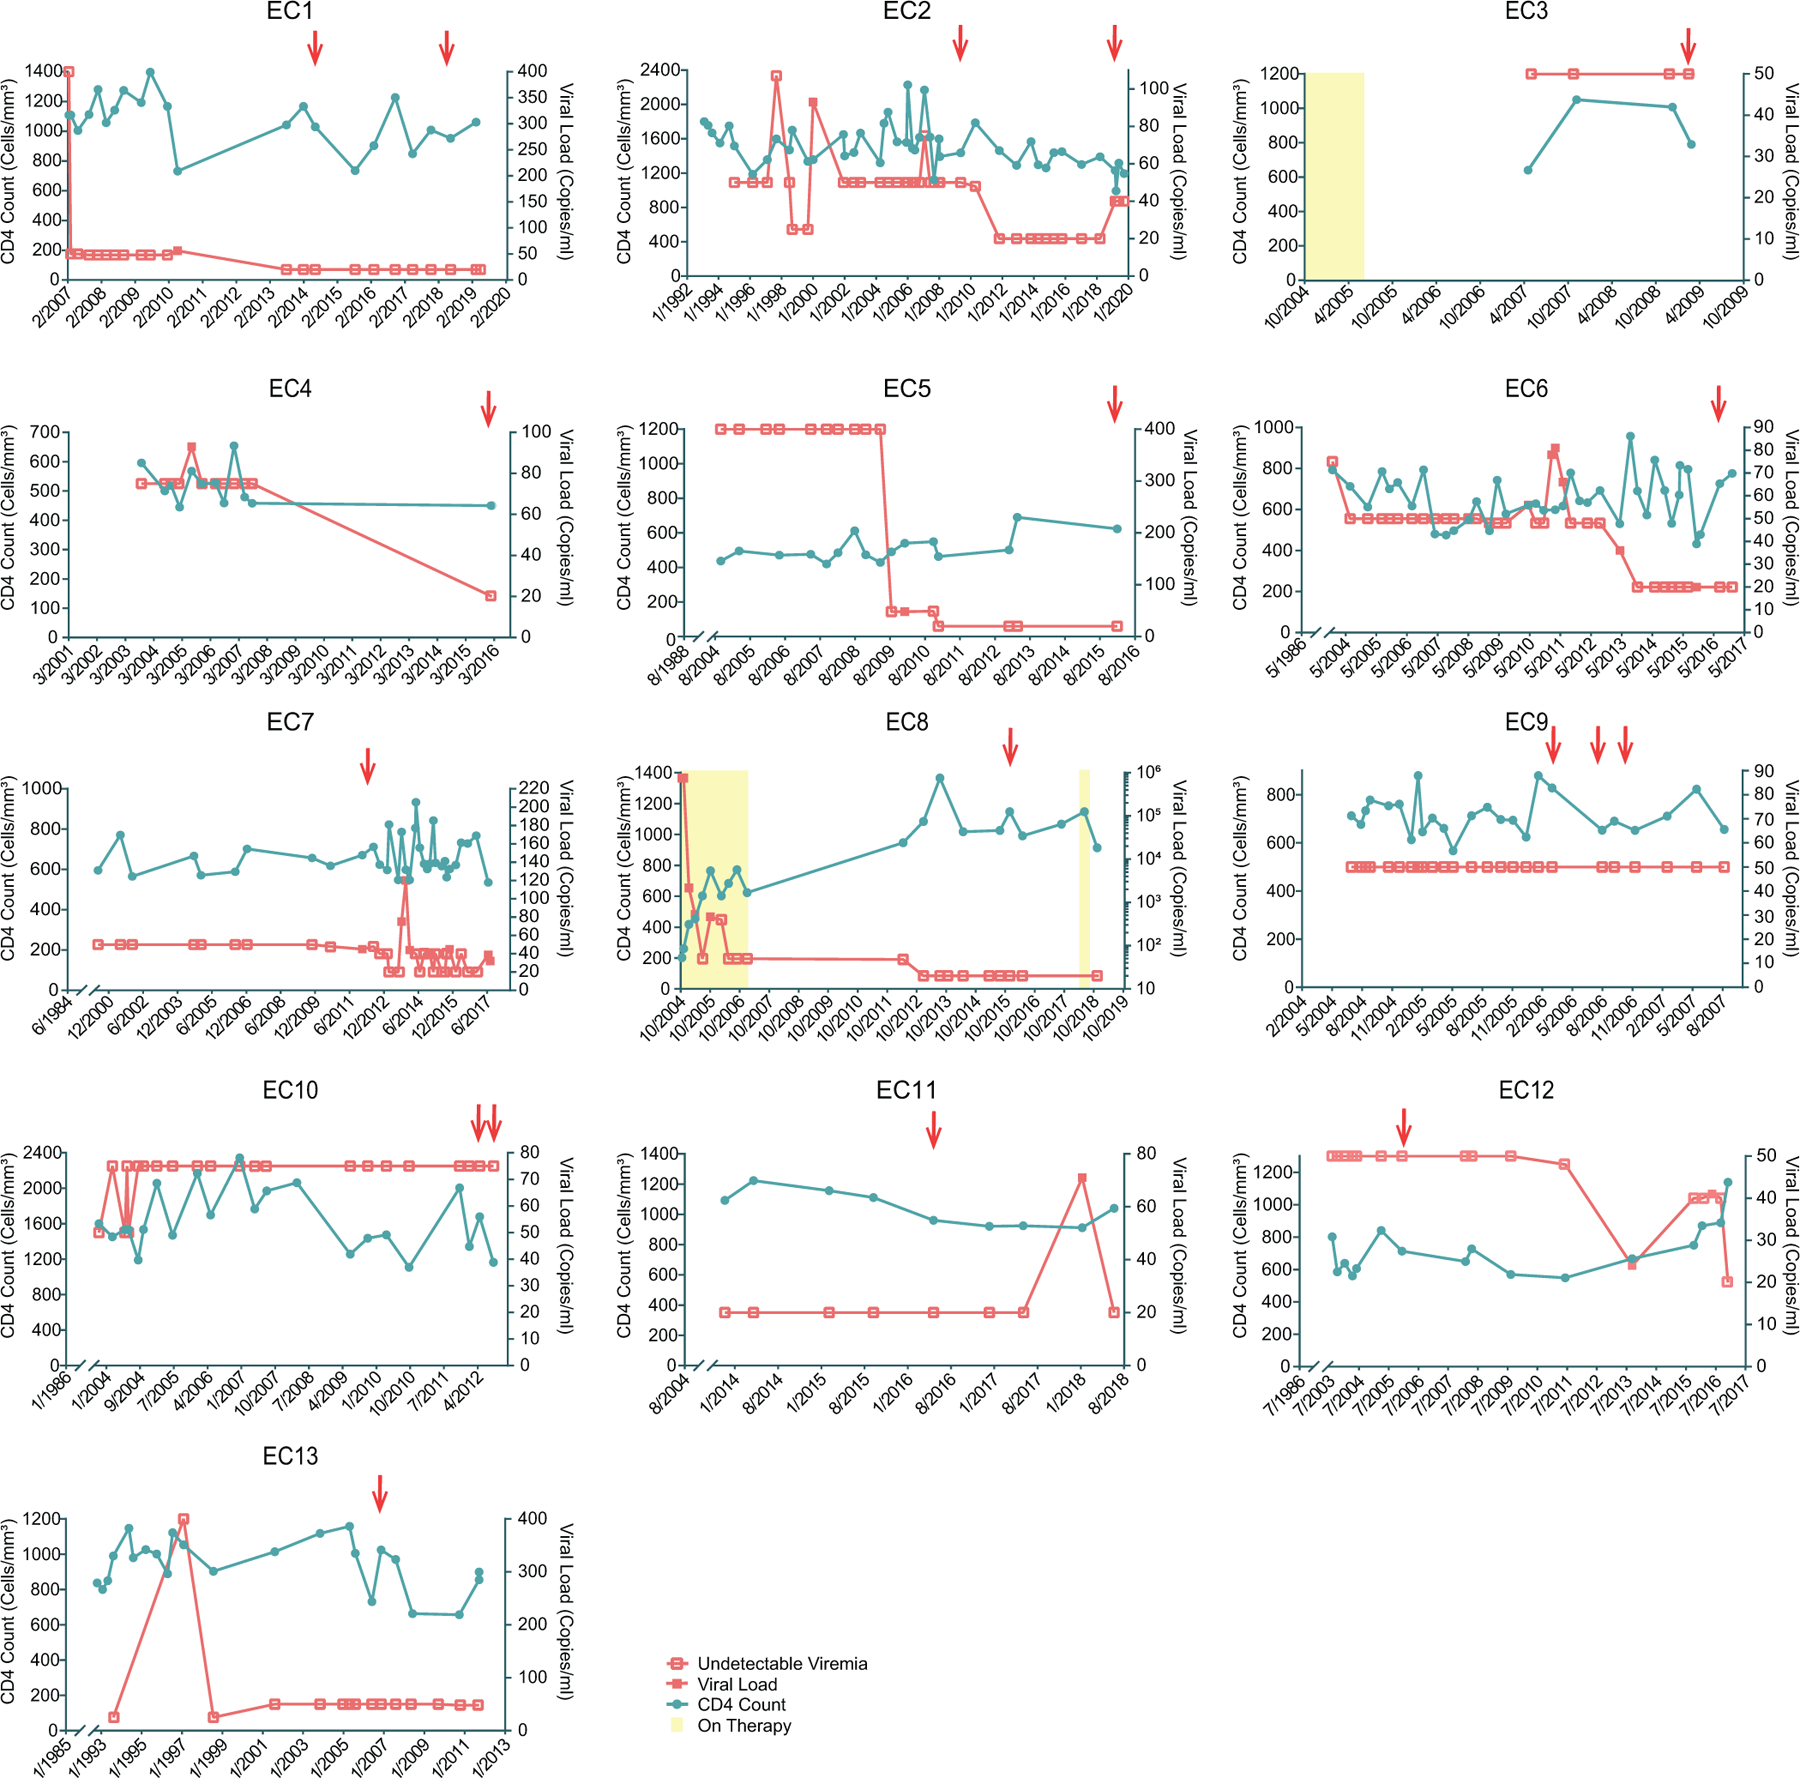
Extended Data Figure 2: Longitudinal evolution of CD4+ T-cell counts and HIV-1 viral loads in EC1-EC13.

The recorded diagnosis date of HIV-1 infection for each study participant is shown as the first date on x-axis. PBMC sampling time points are indicated by red arrows.
