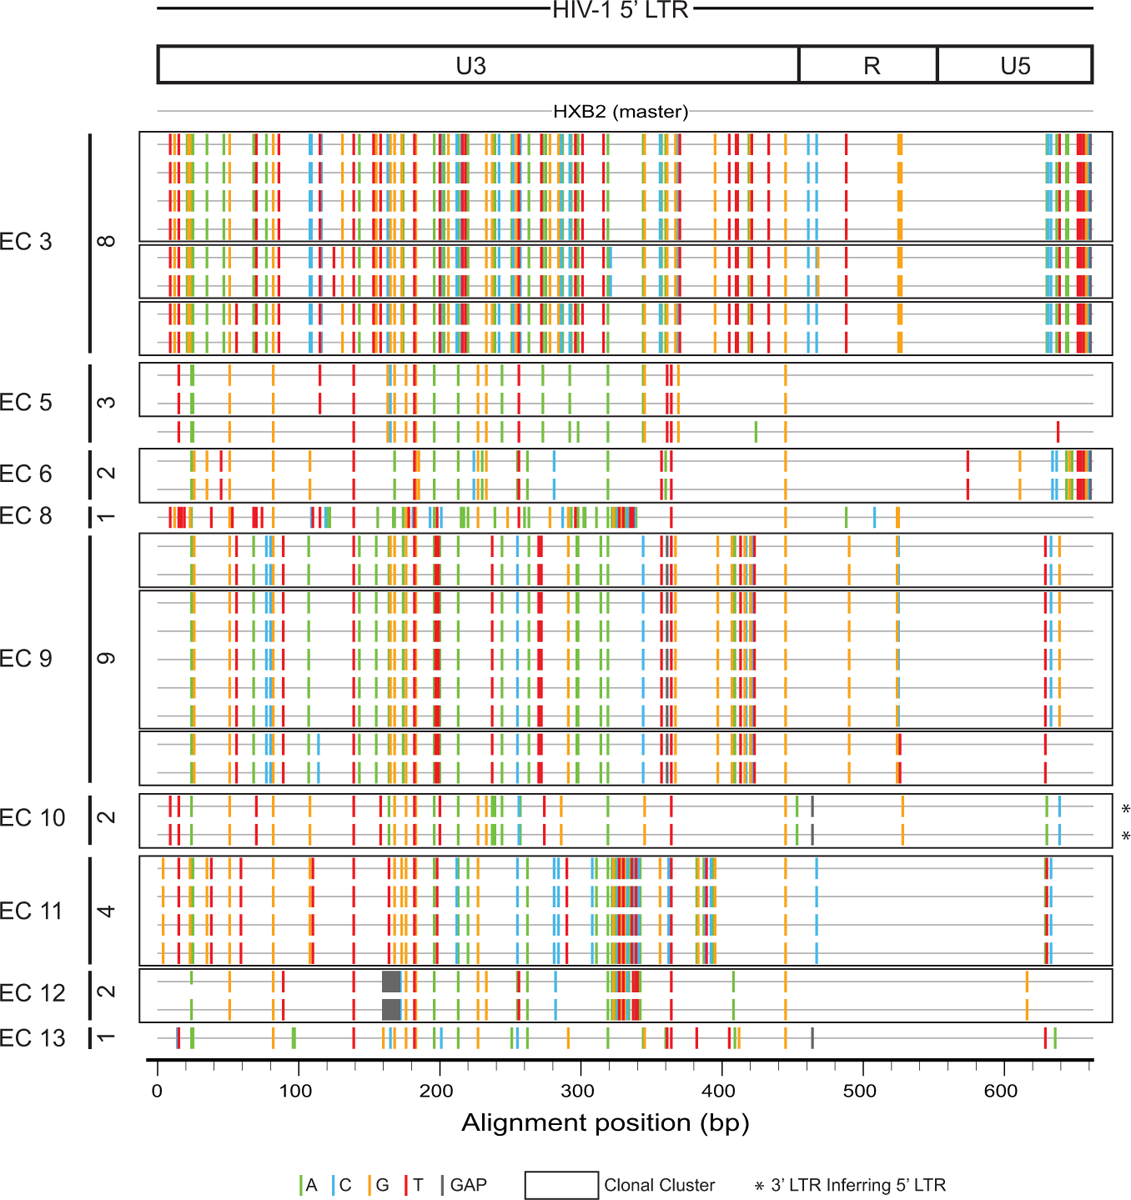
Extended Data Figure 4: Highlighter plot reflecting variations in HIV-1 DNA sequences in 5’ LTR regions from intact proviruses isolated from indicated ECs, relative to HXB2.

Numbers of 5’ LTR sequences of intact proviruses obtained from each individual are shown on the vertical axis. Open boxes indicate clonal clusters.
