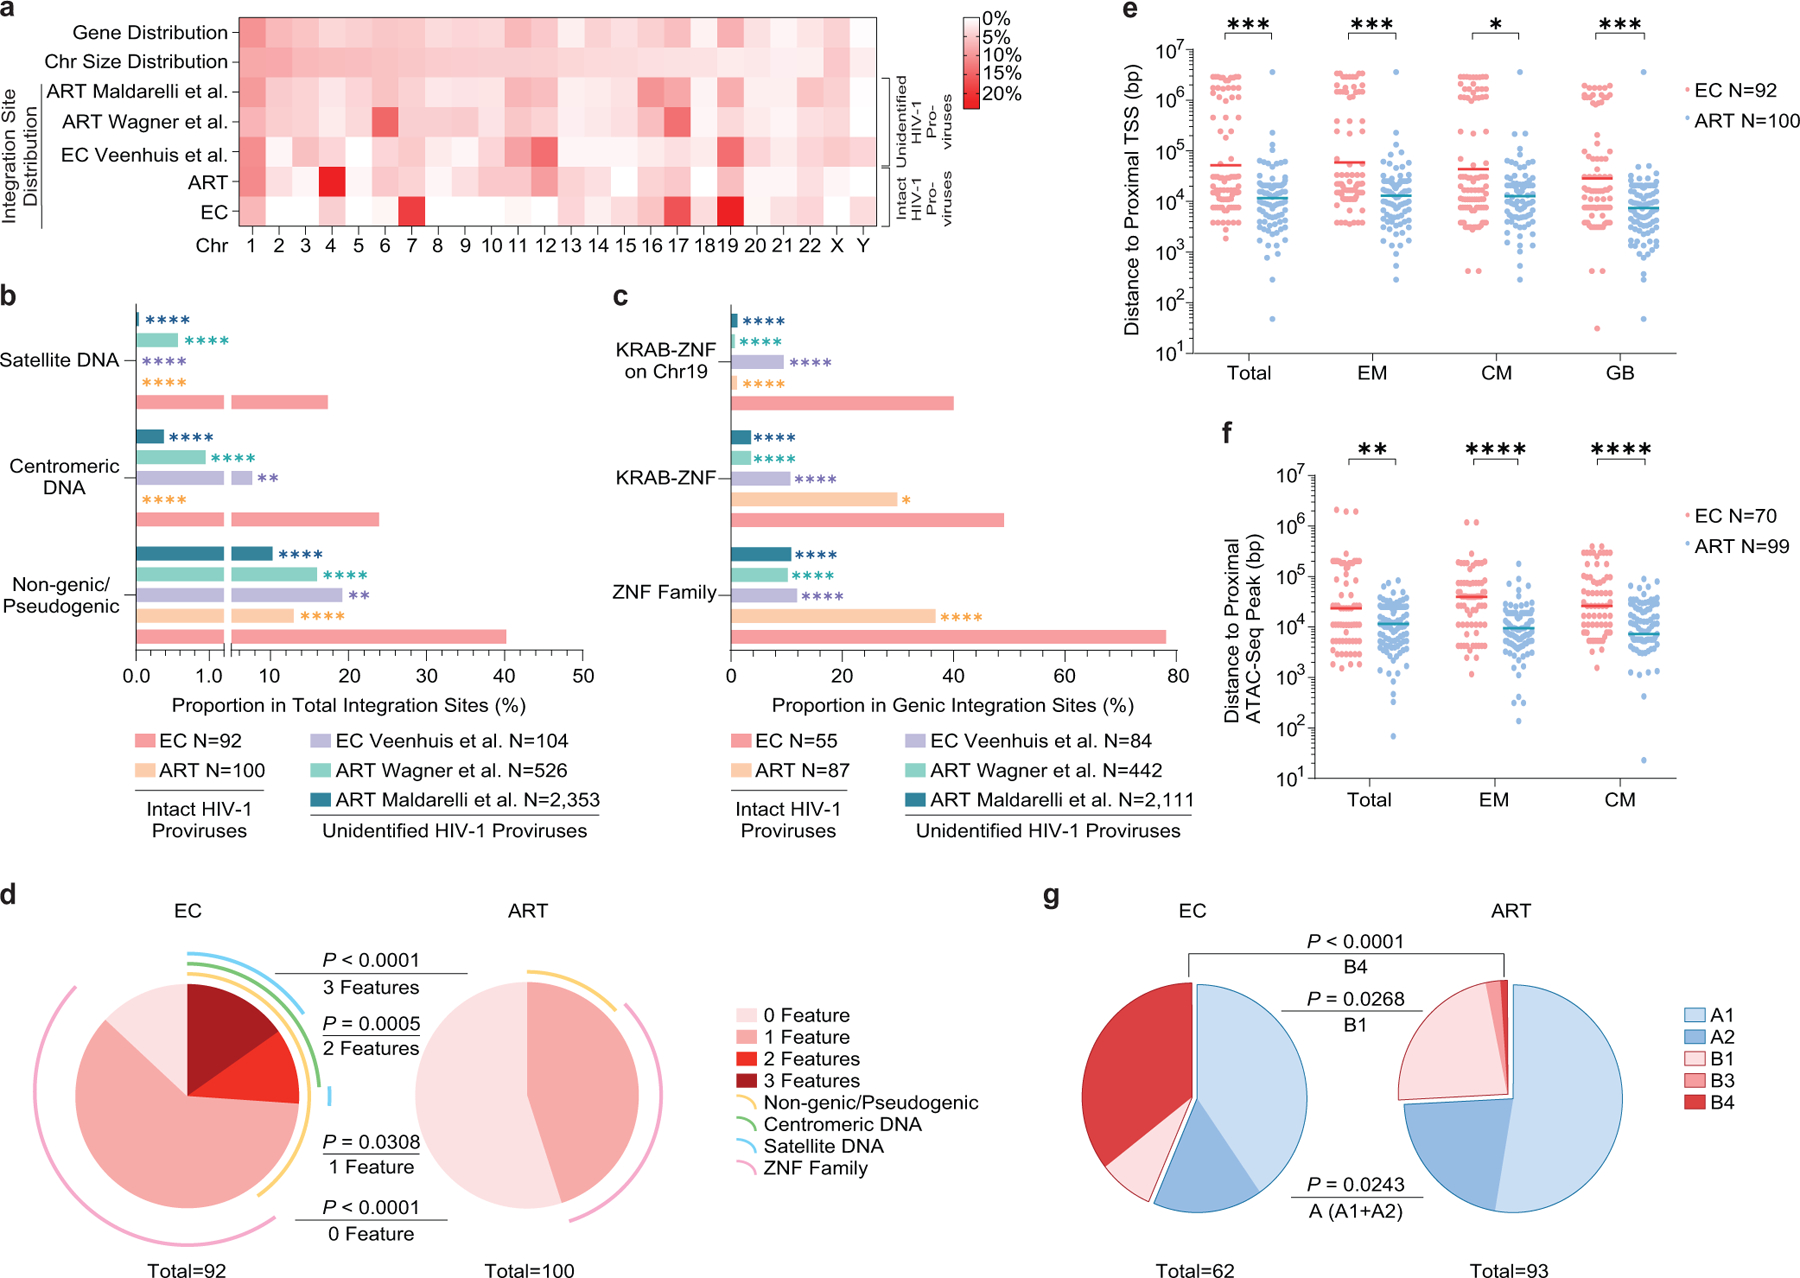
Extended Data Figure 5: Chromosomal integration site features of intact proviruses from ECs after counting clonal sequences individually.

(a): Heatmap indicating the relative proportion of proviral integration sites of intact proviruses in each chromosome in ECs, relative to corresponding data from long-term ART treated individuals13. Proviral integration site data from prior publications are shown for comparative purposes (Veenhuis et al.7, Maldarelli et al16, Wagner et al.14); integration sites from intact and defective proviruses were not distinguished in these studies. Contributions of each chromosome to total number of genes (first row) and to total size of human genome (second row) are included as references. (b-c): Proportion of near full-length intact proviruses located in indicated genomic regions. Data from near full-length intact proviral sequences in long-term ART-treated individuals (ART) are shown for reference purpose13; chromosomal integration sites from unselected (intact and defective) proviral sequences in ECs (Veenhuis et al.7) and in ART-treated individuals (Maldarelli et al16, Wagner et al.14) are also shown for comparison. (d): SPICE diagrams58 demonstrating proportion of intact proviruses with indicated chromosomal integration site features in ECs and ART-treated individuals. (e-f): Chromosomal distance between integration sites of intact proviruses and the most proximal transcriptional start sites (TSS, determined by RNA-Seq) (e) or to the most proximal ATAC-Seq peak (f) in autologous total, central-memory and effector-memory CD4+ T-cells and in GB. Horizontal lines reflect the geometric mean. (g): Proportions of proviral sequences located in structural compartments A and B, as determined based on Hi-C-Seq data published by Rao et al28. Chromosomal integration regions not covered in the study by Rao et al. were excluded from analysis. (f-g): Sequences in genomic regions included in the blacklist for functional genomics analysis identified by the ENCODE and modENCODE consortia27 were excluded due to absence of reliable ATAC-Seq and Hi-C-Seq reads in such repetitive regions. (a-g): All members of clonal clusters were included as individual sequences. (****p<0.0001, ***p<0.001, **p<0.01, *p<0.05, FDR-adjusted two-sided Fisher’s exact tests were used for panels b and c; two-sided Fisher’s exact tests were used for panel d and g, FDR-adjusted two-tailed Mann Whitney U tests were used for panels e and f; all comparisons were made between ECs and reference groups).
