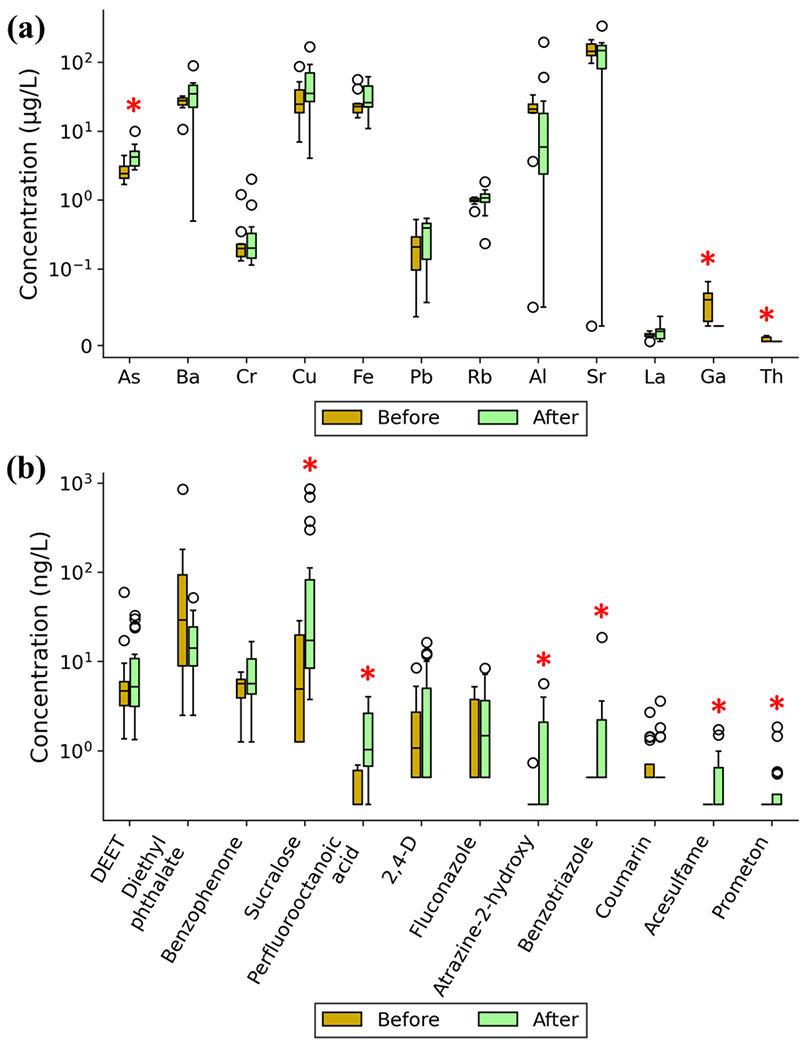
Figure 1.

Box plots showing concentration statistics of top 10 frequently detected (a) trace elements, (b) organic micropollutants and those showed significant (p < 0.05) changes after Hurricane Maria (HM) in the tap water samples collected at Puerto Rico. The black line within each box is the median with box top and bottom as 75th percentile and 25th percentile, respectively. The maximum observation (after removal of outliers) and minimum value are also shown. Outliers are defined based on the interquartile range (IQR) rule. Those contaminants highlighted with red asterisks (*) showed significant (p < 0.05) difference in their concentrations before and after HM in both unpaired t-test and MWU test.
