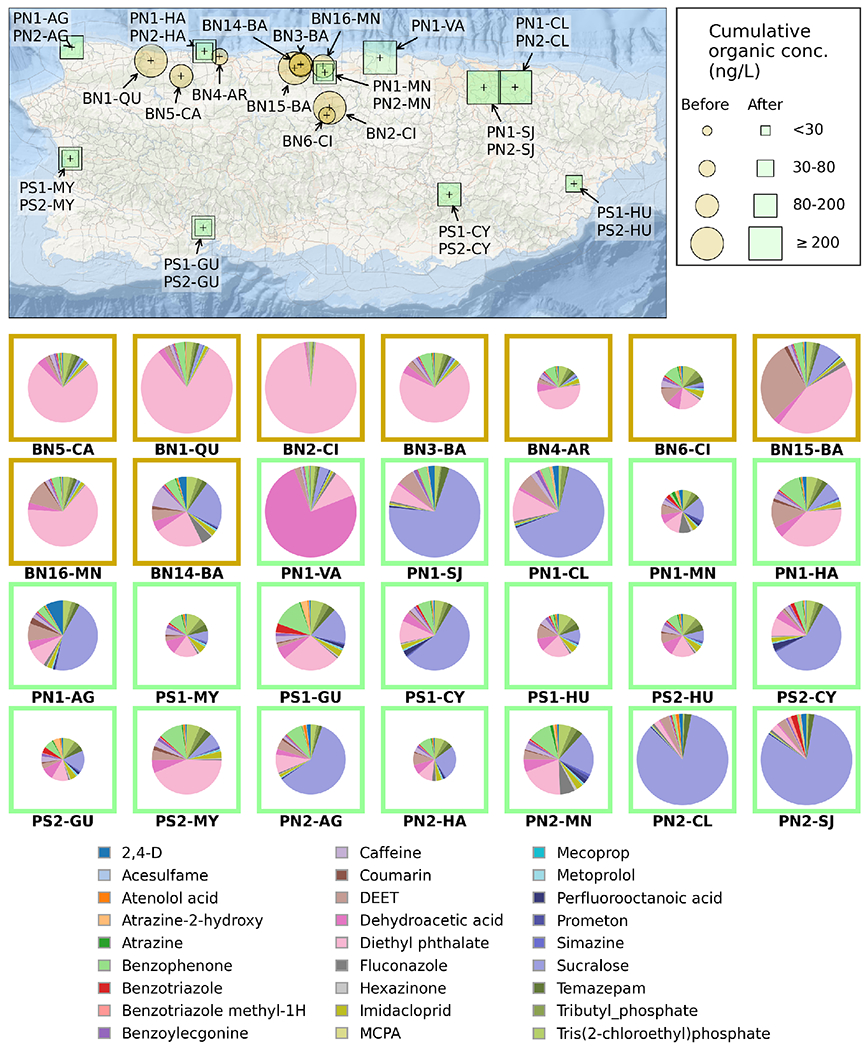
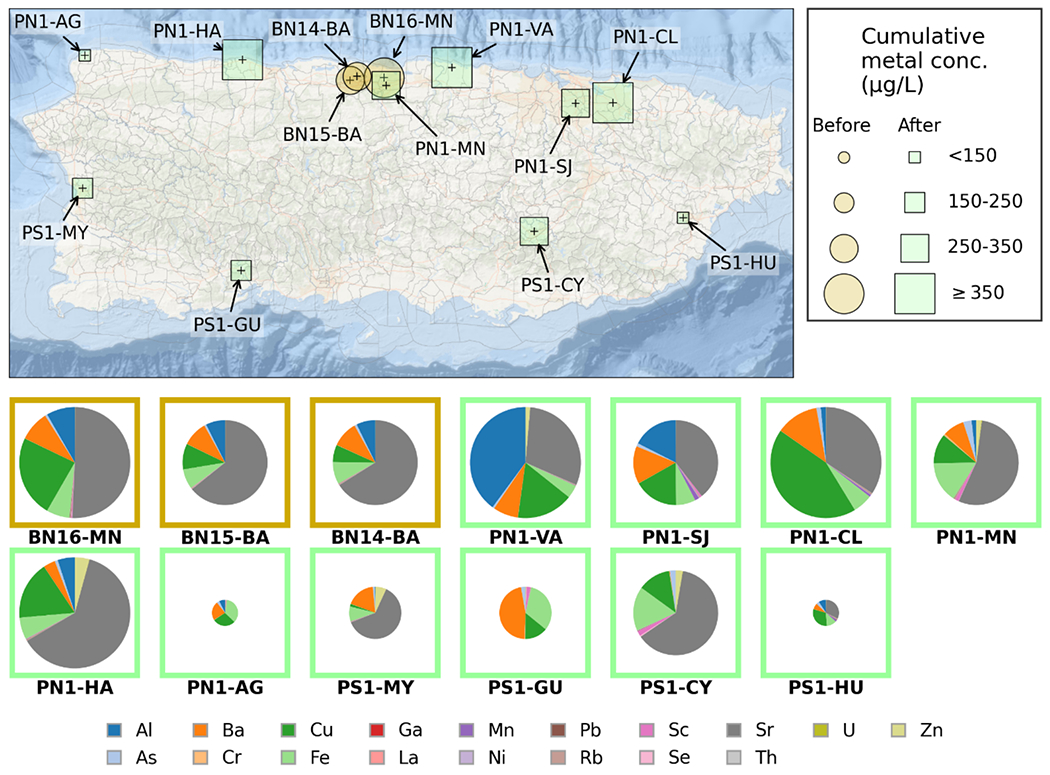
Figure 2.


Top: Cumulative concentration of detected trace elements in raw tap water samples collected at different sampling locations in Puerto Rico measured via ICP-MS, before and after Hurricane Maria (Top); and percentage distribution of element concentration in each tap water sample for before-HM samples (orange square) and post-HM sample (green square) (Bottom pie charts).
Bottom: Cumulative concentration of detected organic micropollutants in tap water samples collected at different sampling locations in Puerto Rico, before and after Hurricane Maria (Top); and percentage distribution of micropollutants concentration in each tap water sample extract for before-HM samples (orange square) and post-HM sample (green square) (Bottom pie charts).
