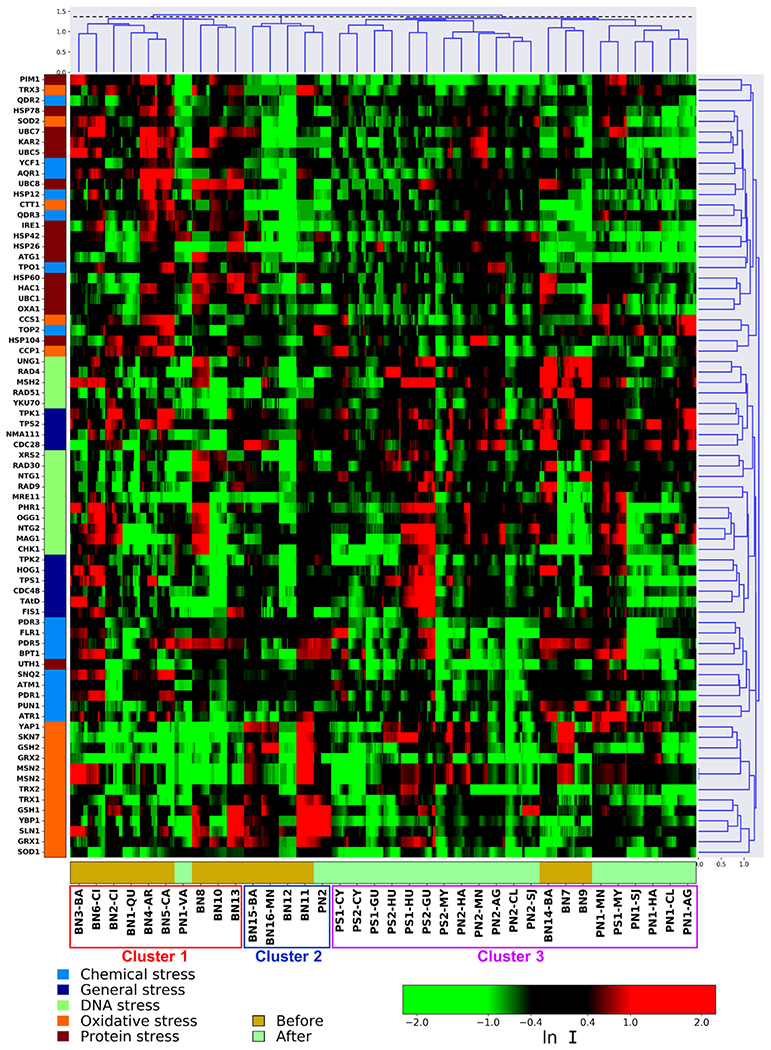
Figure 3.

Hierarchical clustering analysis (HCA) diagram on the basis of differential protein expressions (average lnI) of the 74 stress biomarkers in yeast strains in exposure to tap water extracts (REF=200) across Puerto Rico before and after Hurricane Maria. The mean natural log of positive induction factors (lnI) indicate the magnitude of altered protein expression (scaled by the green-black-red color spectrum). Green color spectrum indicates down-regulation compared to the untreated control without chemical dosage, and red color indicates up-regulation. The lnI values beyond ±2 were indicated as ±2. X-axis top: cluster root of the samples that was cut (dashed line) to present three main clusters. X-axis bottom: sample names color-coded according to time-lines: before HM (light yellow) and after HM (light green). Y-axis left: list of proteins color-coded based on the five stress categories (Table S4). Y-axis right: cluster root of stress response-related proteins.
