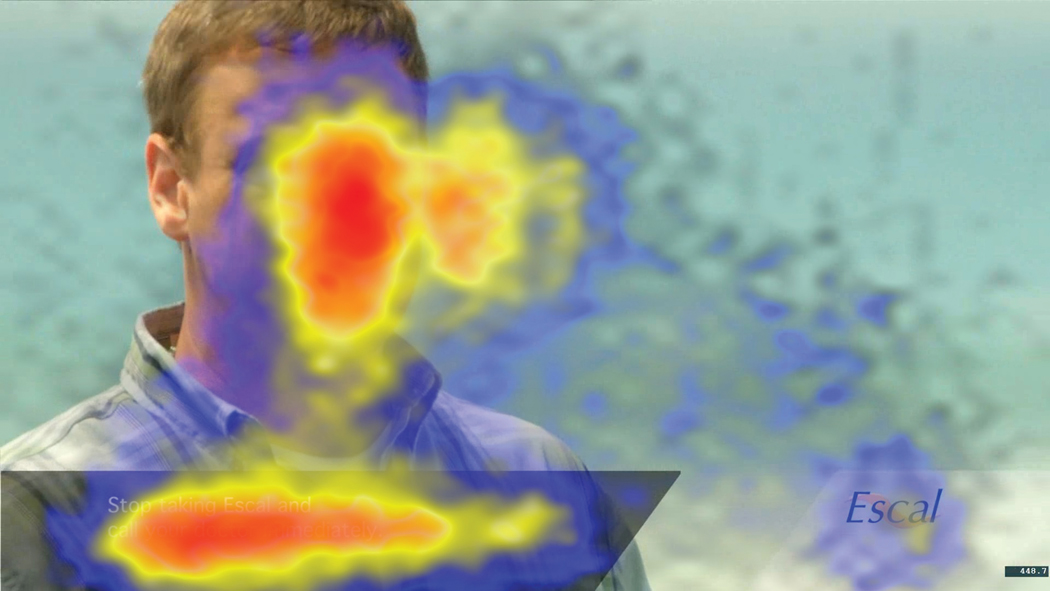
Figure 1.

Heat map for entire duration of the risk text for the low-distractor ad (n = 142). The heat maps utilize a blue-to-red scale to indicate the level of attention by the participants. Red indicates locations with the largest number of observations, followed by orange, yellow, and blue. The risk text appeared in the lower left corner of the screen.
