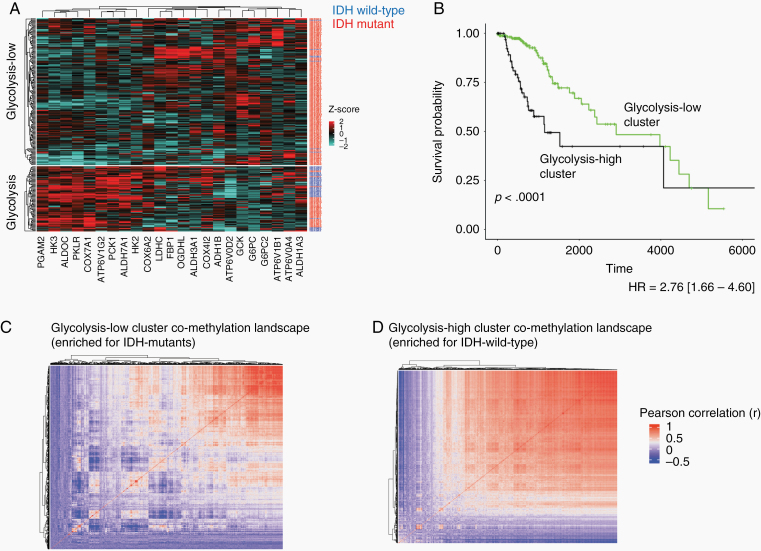
Figure 2.
Validation set analysis showing glycolytic expression (same gene set from Figure 2) predicts patient isocitrate hydrogenase (IDH) status and alternative co-methylation landscapes. (A) Heatmap of patient clusters produced using 23 metabolic genes (blue row labels = IDH wild-type samples; red labels = IDH mutant samples). Cluster2 is significantly enriched for IDH-wild type patients (P < .0001, x2 = 76.76). (B) OS analysis between clusters shows cluster2 patients are associated with significantly worse OS (P < .0001, HR = 2.76 [1.66–4.60]). (C,D) Co-methylation heatmap clustering (Pearson correlation values) of CpG cites for cluster1 (C) and cluster2 (D). Cluster1 (IDH mutant enriched) displays more heterogeneity across methylation sites while cluster2 (IDH mutant enriched) appeared more uniformly correlated.

