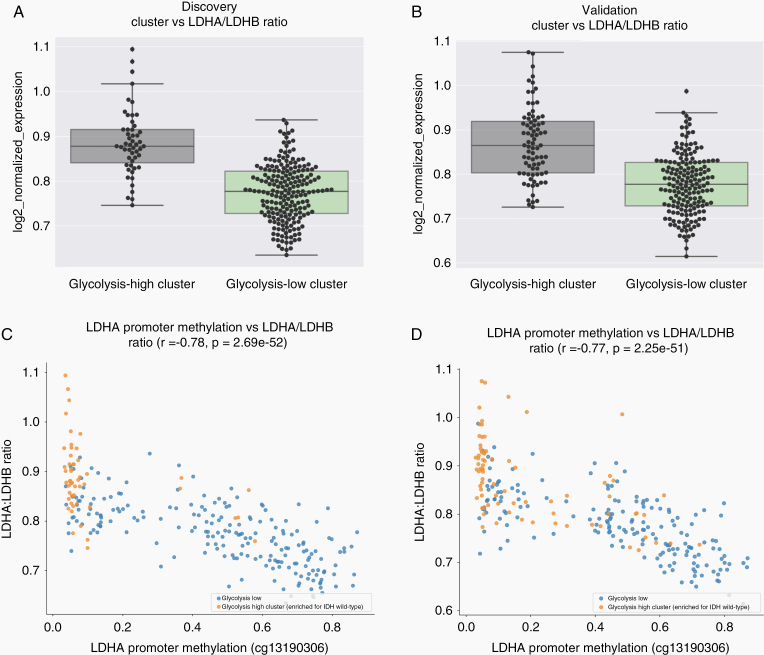
Figure 3.
Glycolytic expression is associated with an elevated LDHA/LDHB ratio and decreased LDHA promoter methylation. (A) Boxplots showing a significantly elevated LDHA/LDHB ratio in the glycolytic-high cluster (cluster1) for the discovery set (P = 4.62e−15). (B) Boxplots showing a significantly elevated LDHA/LDHB ratio in the glycolytic-high cluster (cluster2) for the validation set (P < 0.0001). (C,D) The level of LDHA promoter methylation was also inversely associated with the LDHA/LDHB ratio in both the discovery set (C) (r = −0.78, P = 2.69e−52) and the validation set (D) (r = −0.77, P = 2.25e−51).

