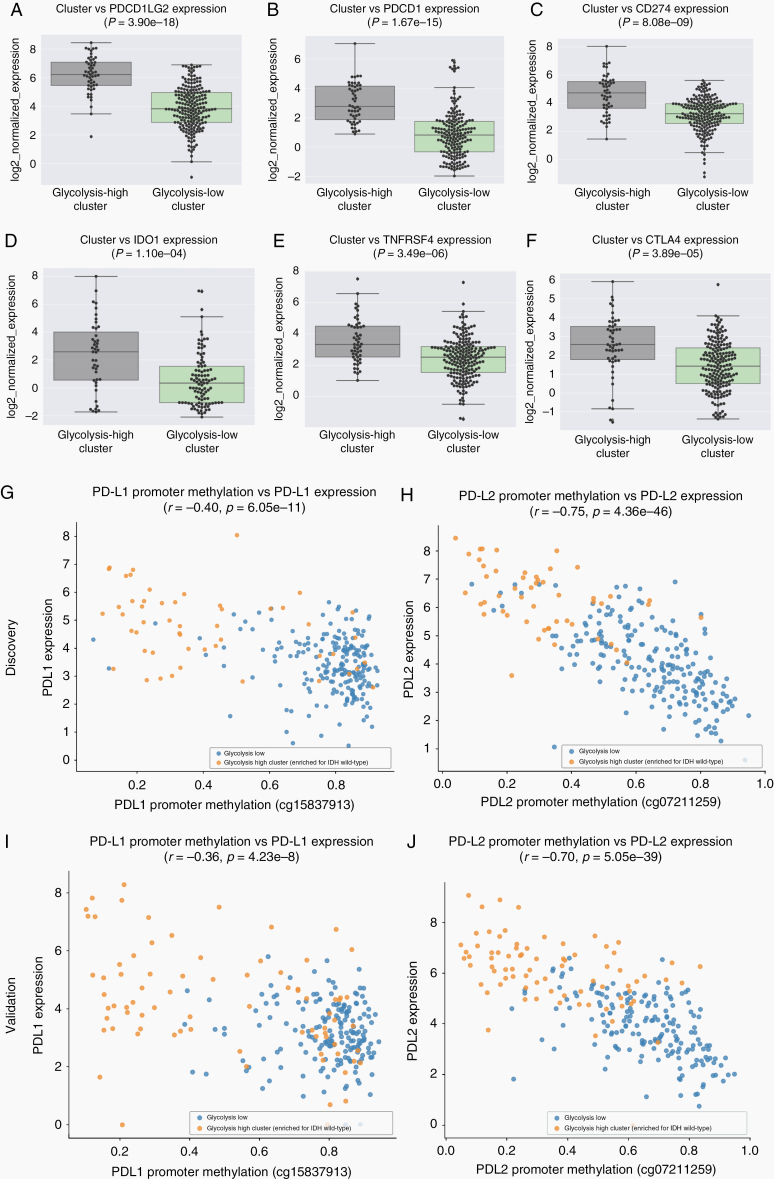
Figure 4.
Immune checkpoint expression analysis between clusters and promoter methylation analysis. (A–F) Immune checkpoint genes with elevated expression in cluster1 (glycolysis-high, IDH wild-type enriched) were (A) PDCD1LG2 (PDL2), (B) PDCD1 (PD1), (C) CD274 (PDL1), (D) IDO1, (E) TNFRSF4 (OX40), and (F) CTLA4 (P = 3.90e–18, P = 1.67e−15, P = 8.08e−09, P = 1.10e−4, P = 3.49e−6, and P = 3.89e−05, respectively). (G) PD-L1 and (H) PD-L2 show inverse correlations between promoter methylation and gene expression (r = −0.40, P = 6.05e−11 and r = −0.75, P = 4.36e−46, respectively). (I,J) Similar results were reproduced in the validation set for (I) PDL1 (r = −0.36, P = 4.23e−8) and (J) PDL2 (r = −0.70, P = 5.05e−39).

