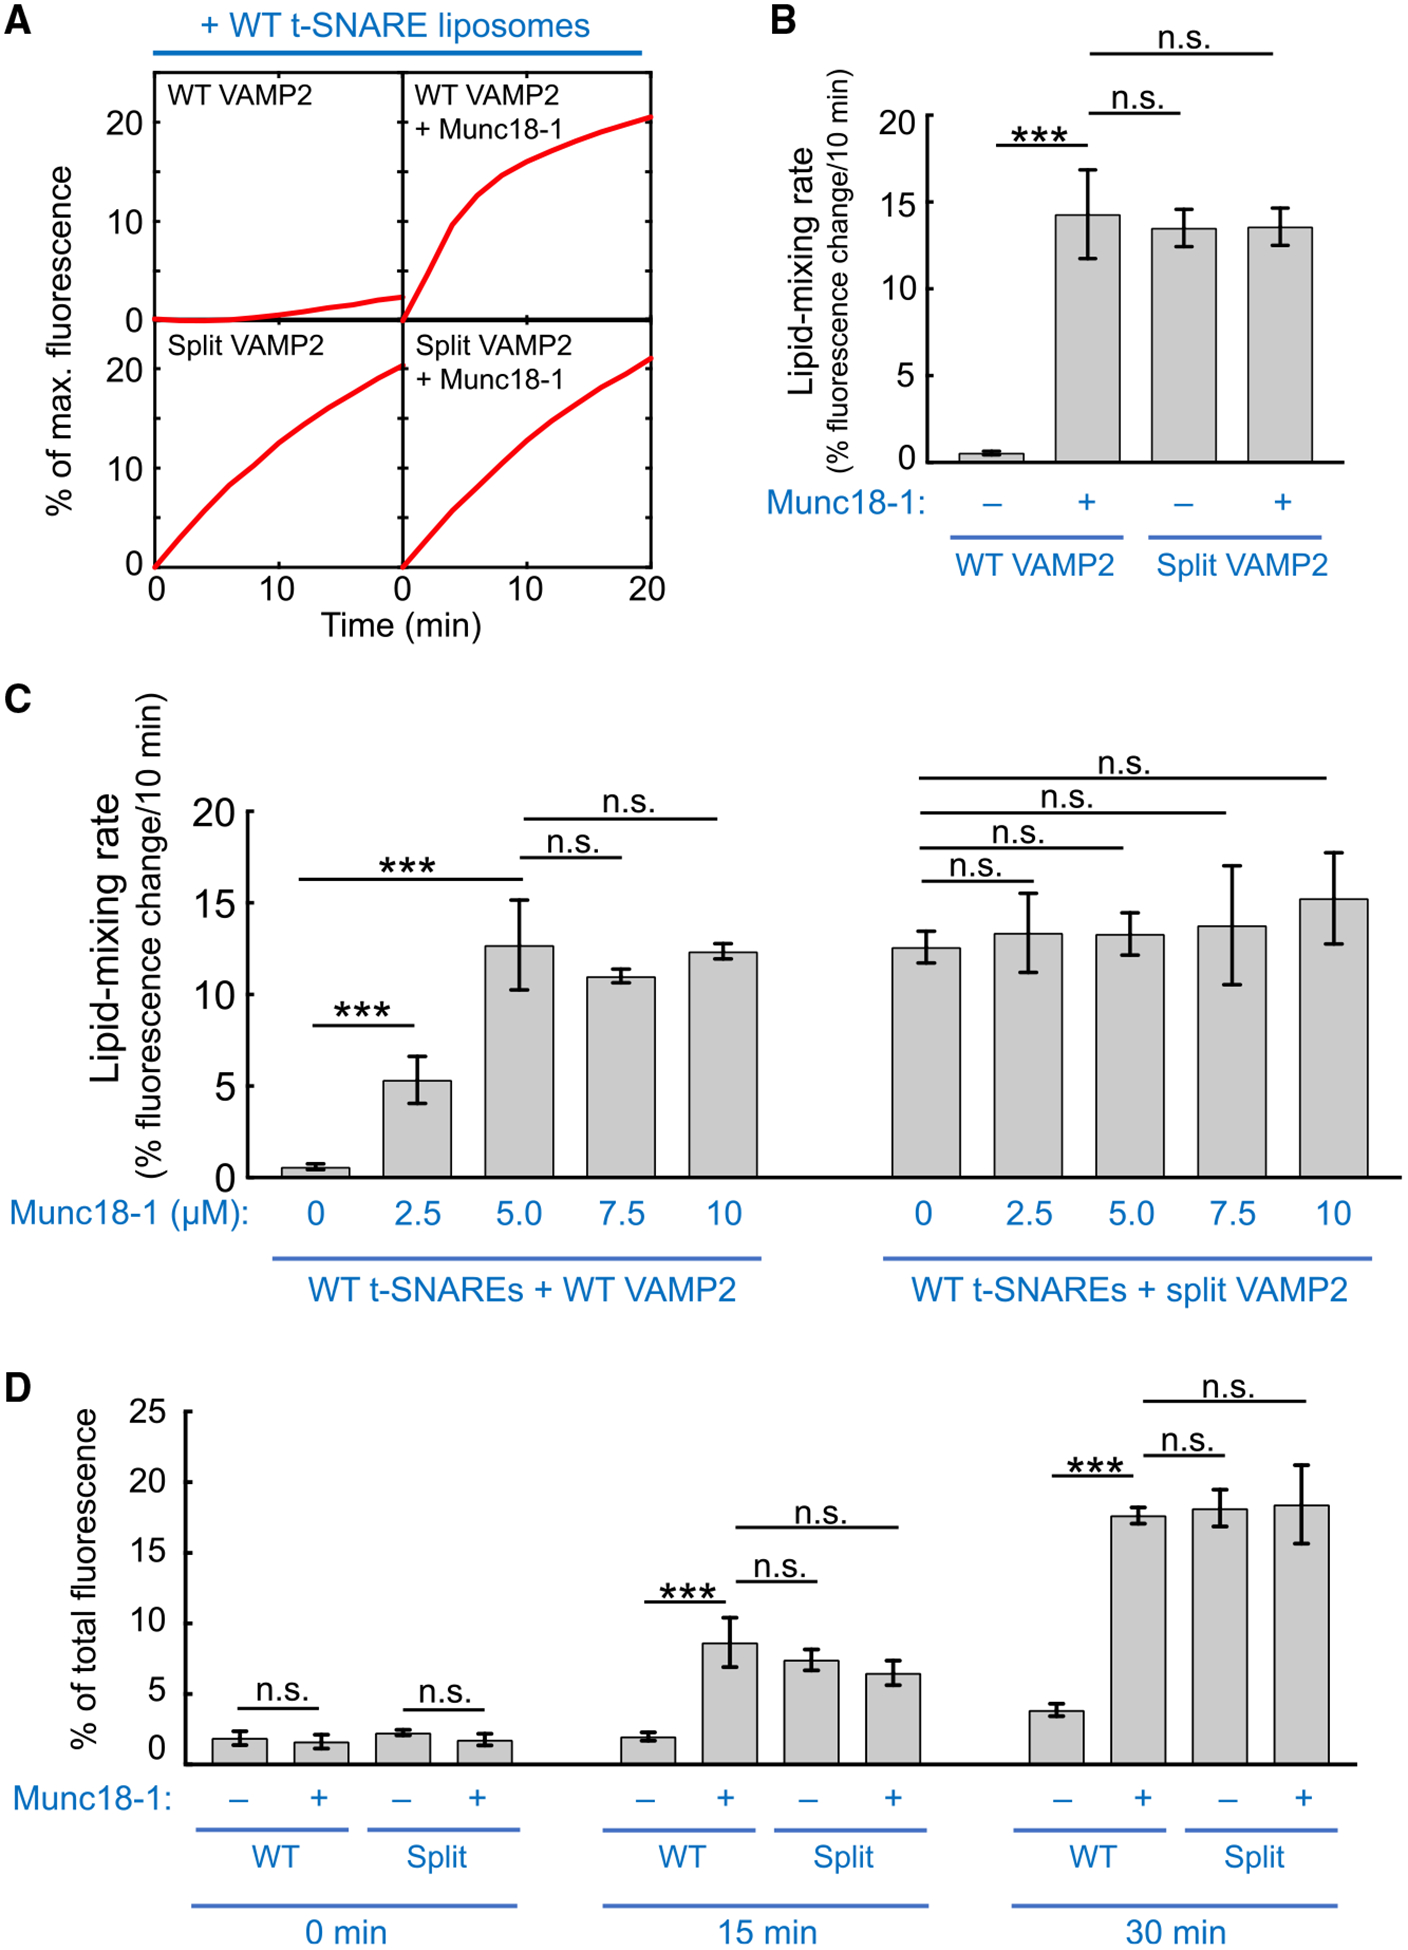
Figure 2. Split SNARE-Driven Membrane Fusion Mimics the SM Protein-Activated Fusion Reaction.

(A) Liposomes harboring WT or split VAMP2 (depicted in Figure 1B, right) were directed to fuse with liposomes containing WT t-SNAREs (syntaxin-1 and SNAP-25) in the absence or presence of 5 μM Munc18–1. The kinetics of the fusion reactions was measured using a FRET-based lipid-mixing assay. In this work, Munc18–1 was added at the same molar concentration (5 μM) as SNAREs to reflect their 1:1 binding stoichiometry (Dulubova et al., 2007; Shen et al., 2007; Yu et al., 2013). Higher concentrations of Munc18–1 did not further increase the rate of the liposome fusion reaction driven by WT SNAREs (Figure S1).
(B) Initial lipid-mixing rates of the fusion reactions shown in (A).
(C) Dose dependence of Munc18–1 in liposome fusion reactions mediated by WT or split VAMP2. Liposomes harboring WT or split VAMP2 (depicted in Figure 1B, right) were directed to fuse with liposomes containing WT t-SNAREs (syntaxin-1 and SNAP-25) in the absence or presence of Munc18–1 at the indicated concentrations. The kinetics of the fusion reactions was measured using a FRET-based lipid-mixing assay.
(D) Liposomes harboring WT or split VAMP2 (depicted in Figure 1B, right) were incubated with WT t-SNARE liposomes containing syntaxin-1 and SNAP-25 at 4°C to assemble trans-SNARE complexes between membrane bilayers. Relative amounts of assembled trans-SNARE complexes are presented as percentages of maximum rhodamine fluorescence.
In (B)–(D), data are presented as mean ± SD (n = 3). The p values were calculated using Student’s t test. n.s., p > 0.05. ***p < 0.001. See also Figure S1.
