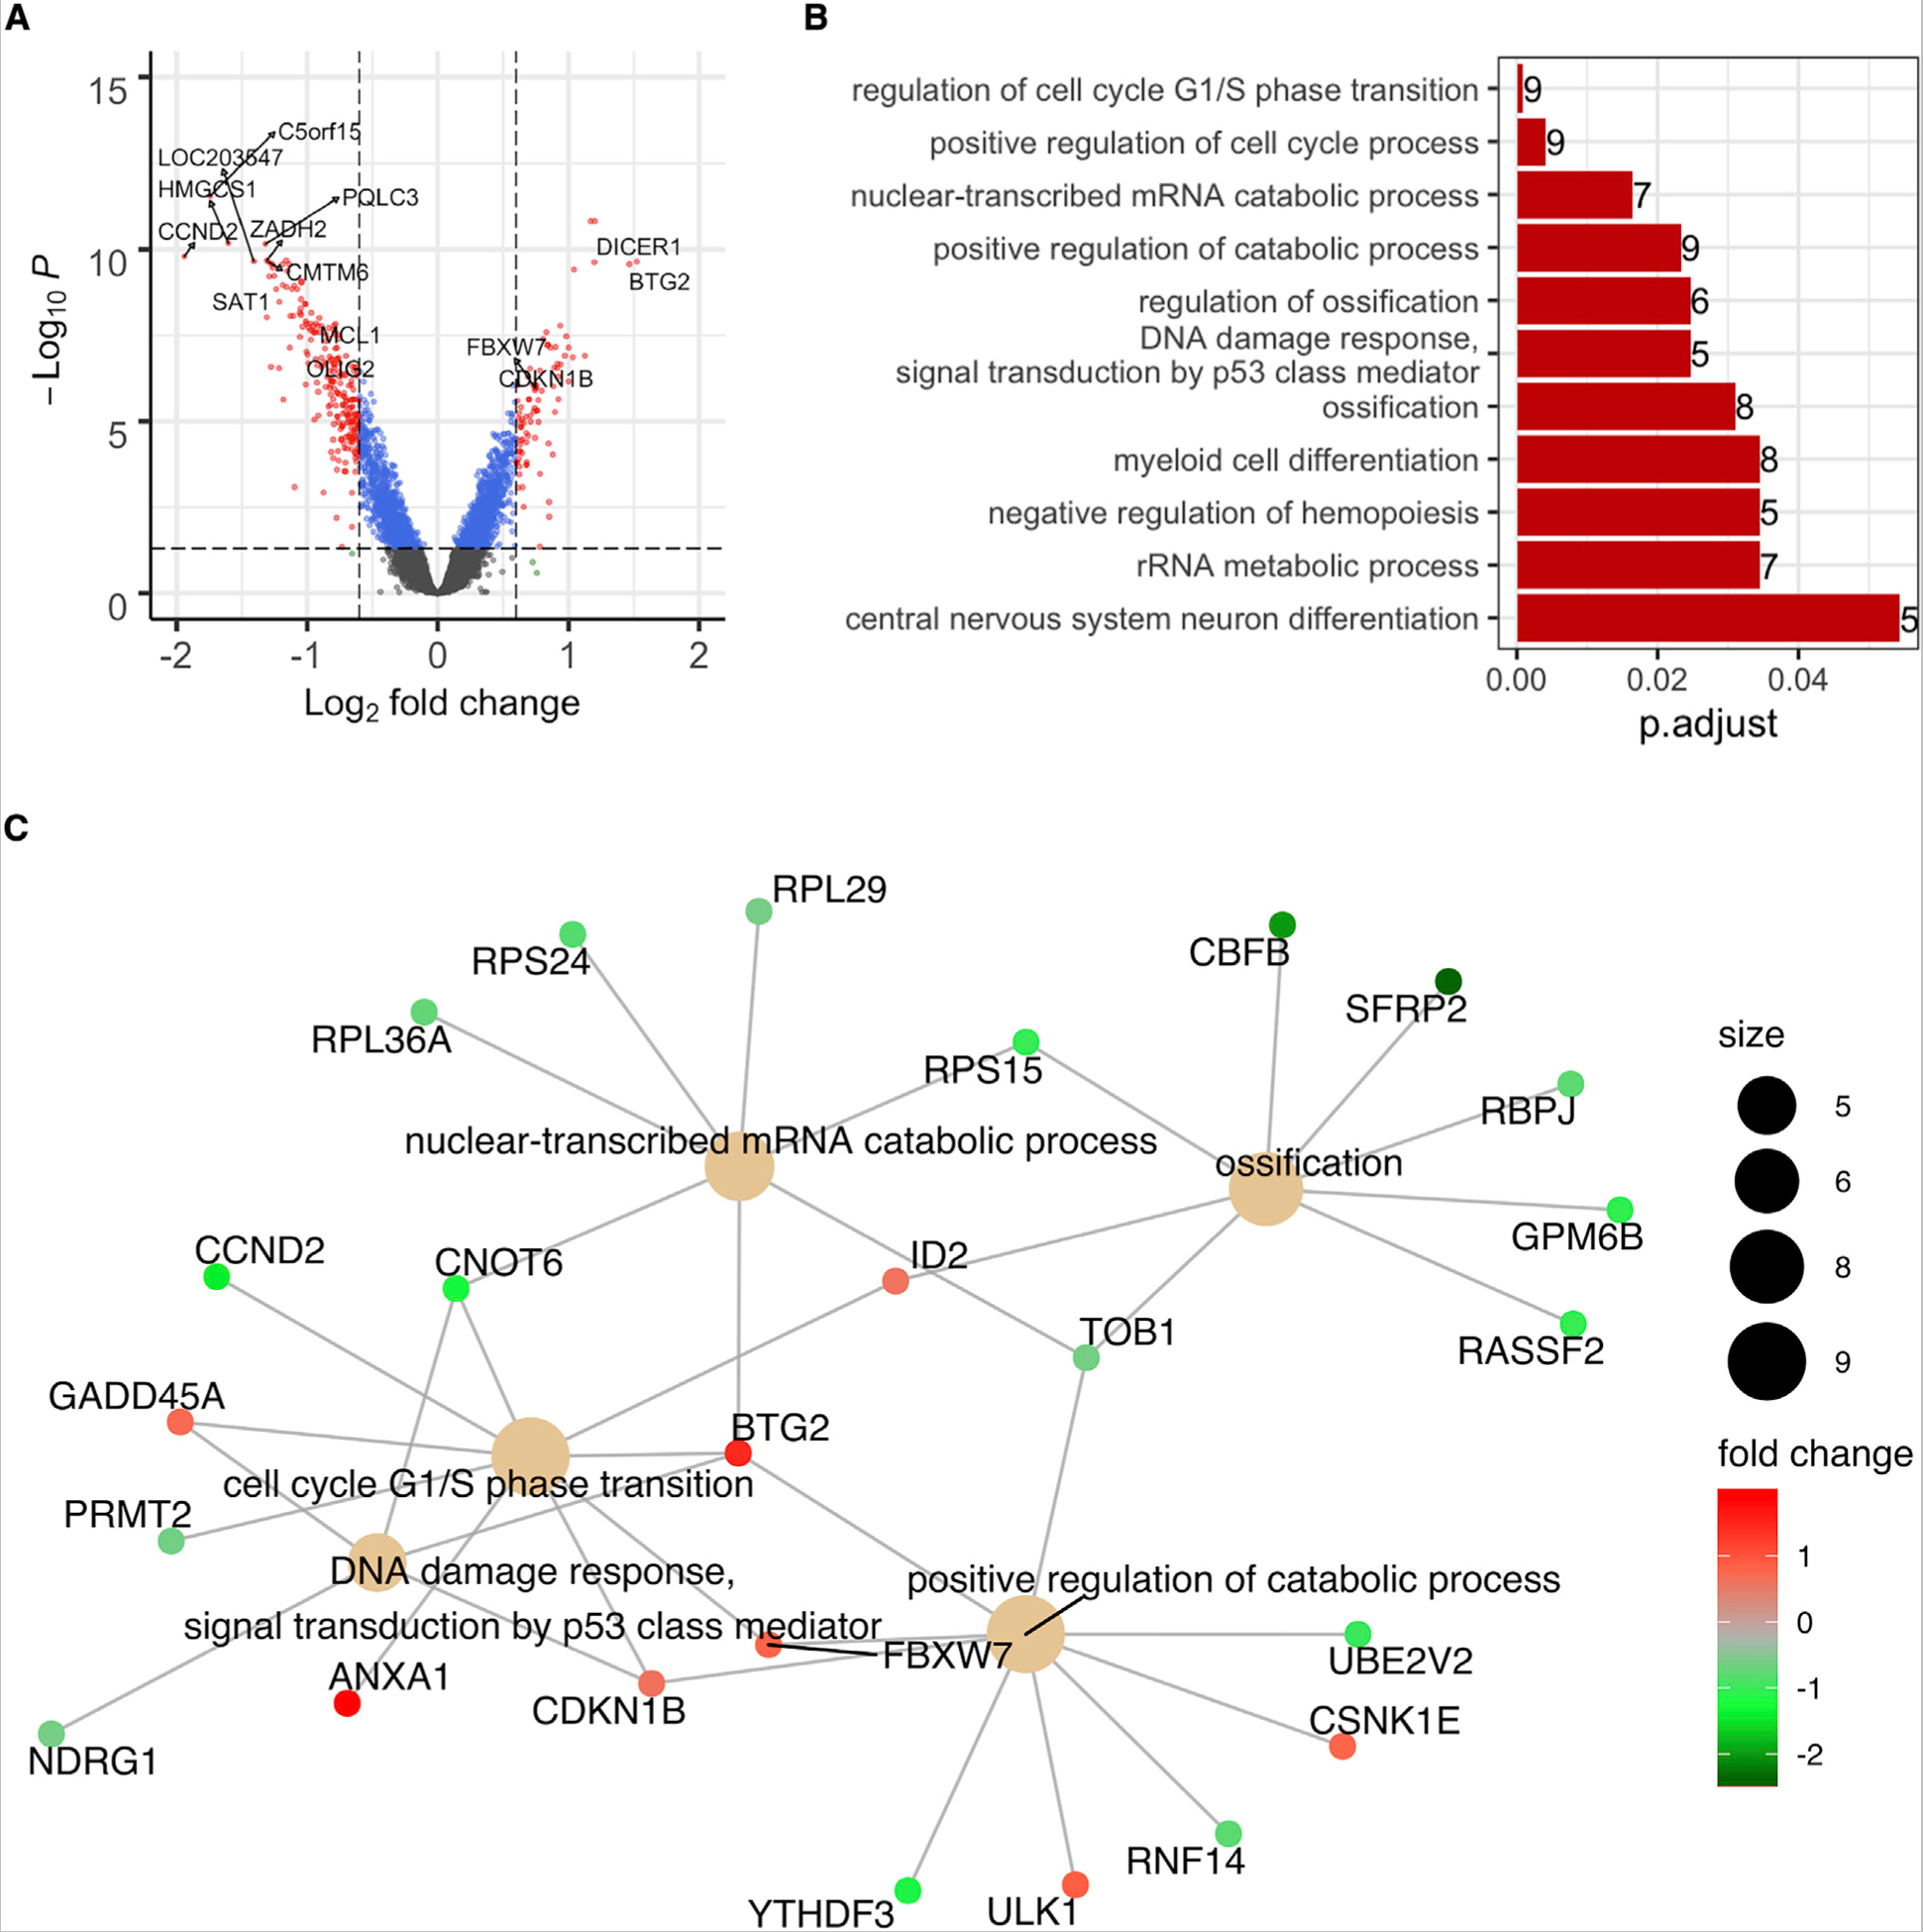
Figure 4. Molecular Pathways Regulated by Piwil1.

(A) Volcano plot of differentially expressed genes in 3832 GSCs after Piwil1 knockdown.
(B) Gene Ontology analysis of differentially expressed genes in 3832 GSCs after Piwil1 knockdown. Bar plot shows top altered pathways and the numbers at the right end of each bar show the numbers of genes affected in each pathway.
(C) Network map of top differentially expressed genes and pathways in 3832 GSCs after Piwil1 knockdown. The size of the circle denotes gene numbers in each pathway. Fold change in gene expression is shown.
