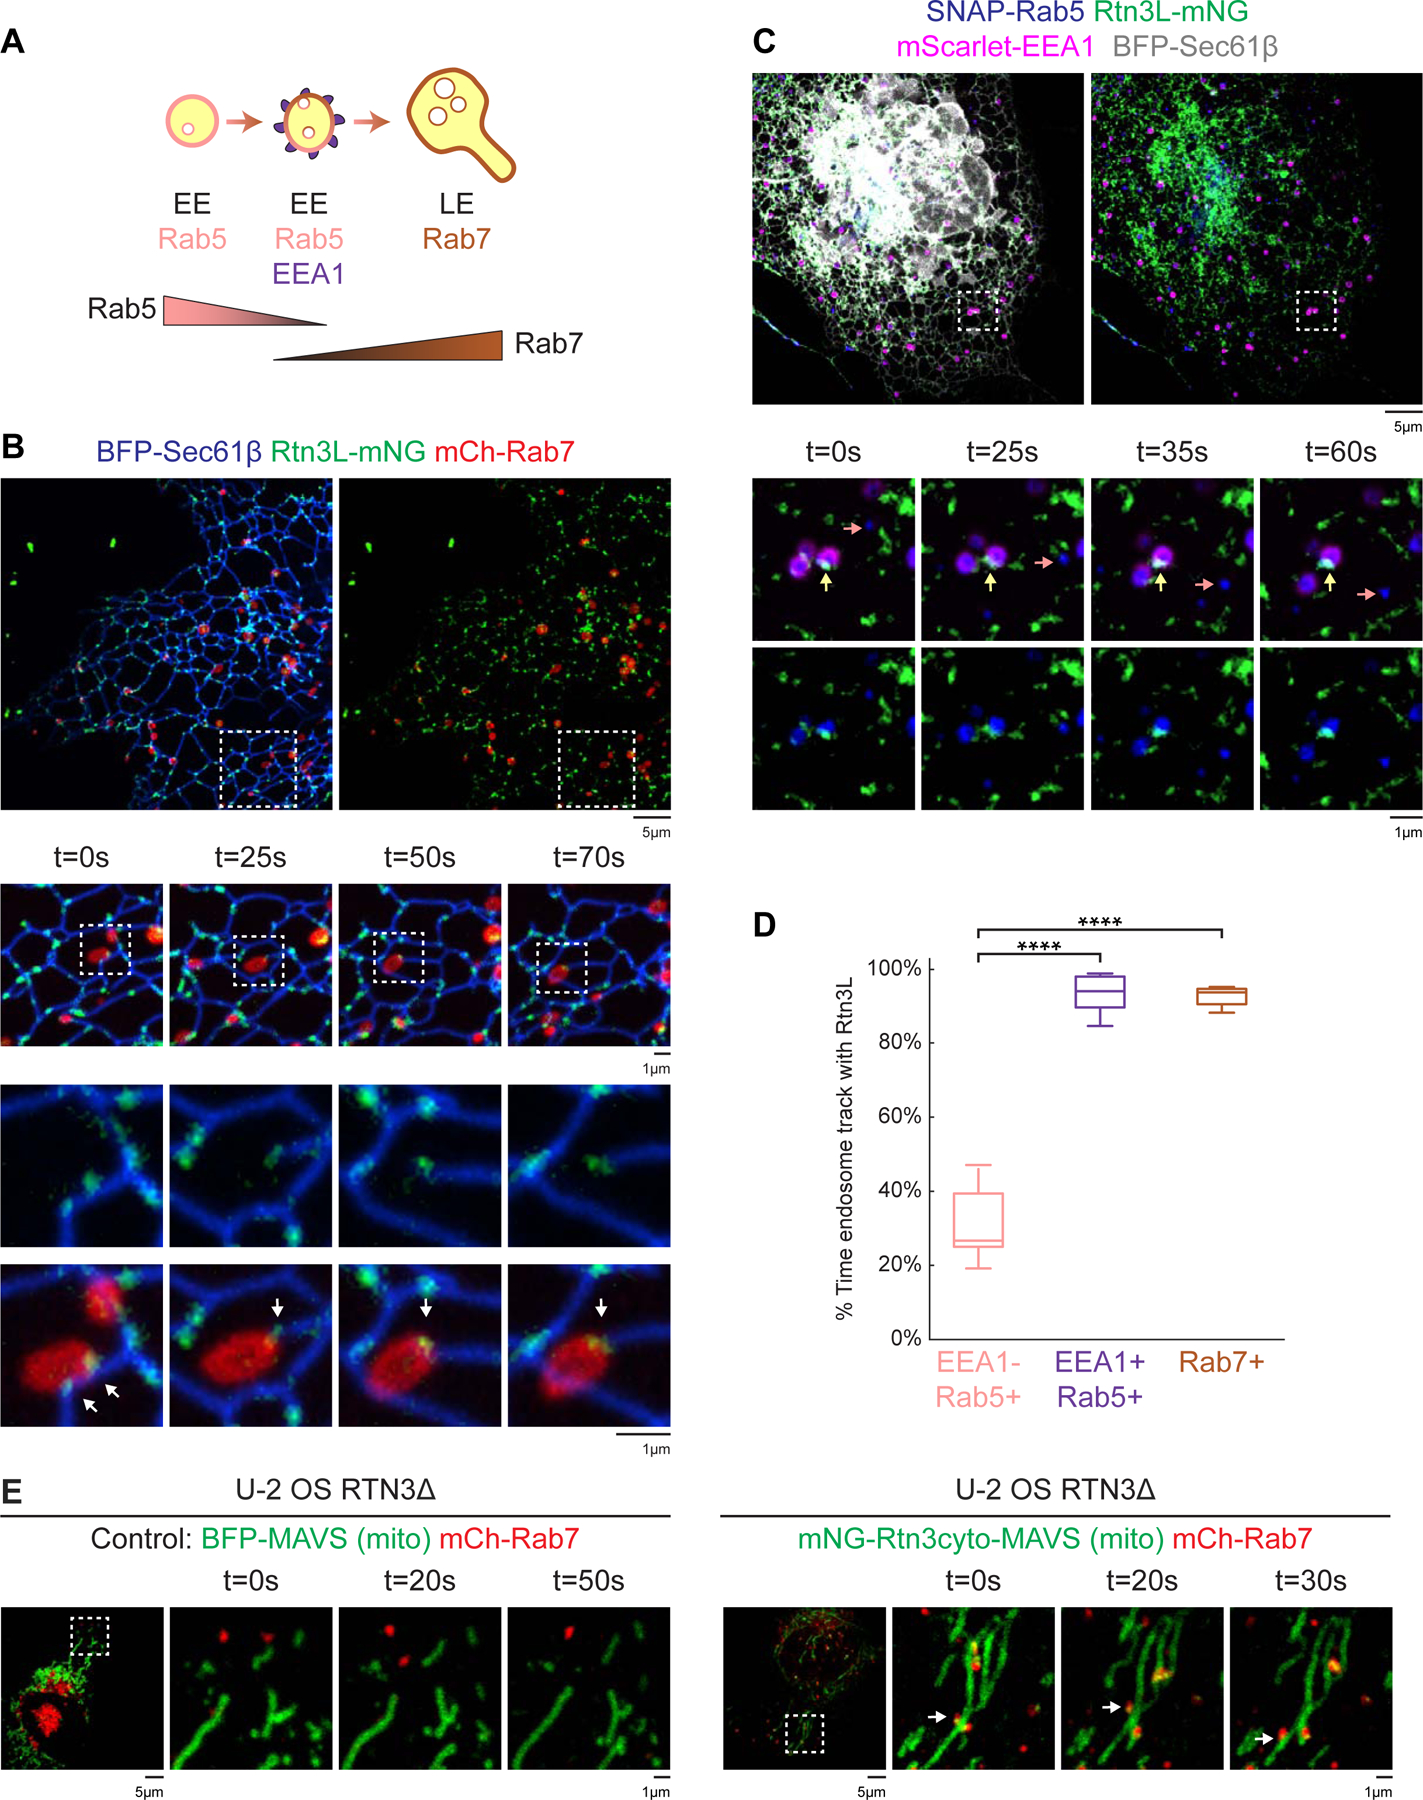
Figure 3. Rtn3L puncta are recruited to ER-endosome MCSs during maturation.

(A) Cartoon diagram of Rab5, EEA1, and Rab7 recruitment during endosome maturation. (B) Rtn3L puncta were tracked relative to LEs in live COS-7 cells co-transfected with Rtn3L-mNG (green), BFP-Sec61β (ER, blue), and mCh-Rab7 (LEs, red). Images below show time-lapse 10 µm x 10 µm and 3 µm x 3 µm insets, respectively. (C) Rtn3L puncta localization relative to moving early endosomes (EEs) in COS-7 cells co-transfected with Rtn3L-mNG (green), BFP-Sec61β (ER, grey), SNAP-Rab5 (blue), and mScarlet-EEA1 (magenta). Representative time lapse insets are 5 µm x 5 µm. Note that a Rab5 EE that is EEA1+ (magenta, marked by yellow arrows) tracks with an Rtn3L punctum over time. In contrast, a Rab5+ EE that is EEA1- (marked by pink arrows) did not associate with an Rtn3L punctum over time. (D) The percent of time that each endosome population associates with Rtn3L puncta during 2min movies (from data represented in B and C). Endosomes are binned according to their maturation stages: EEA1-/Rab5+ (early maturation stage EEs, 84 endosomes from n=10 cells), EEA1+/Rab5+ (late maturation stage EEs, 87 endosomes from n=10 cells) and Rab7+ endosomes (LEs, 82 endosomes from n=10 cells). (E) Representative time-lapse images of U-2 OS RTN3Δ cells expressing mCh-Rab7 (LEs) and BFP-MAVS (left panels) or mNG-Rtn3cyto-MAVS (right panels) reveals that ectopically localized Rtn3cyto-MAVS can tether LEs (red) to mitochondria (green). Statistical analyses were performed with one-way ANOVA, p-value from Tukey’s test: ****p<0.0001. Scale bars were 5 µm, 1 µm for insets. See also Figure S2, Movie S3-S6.
