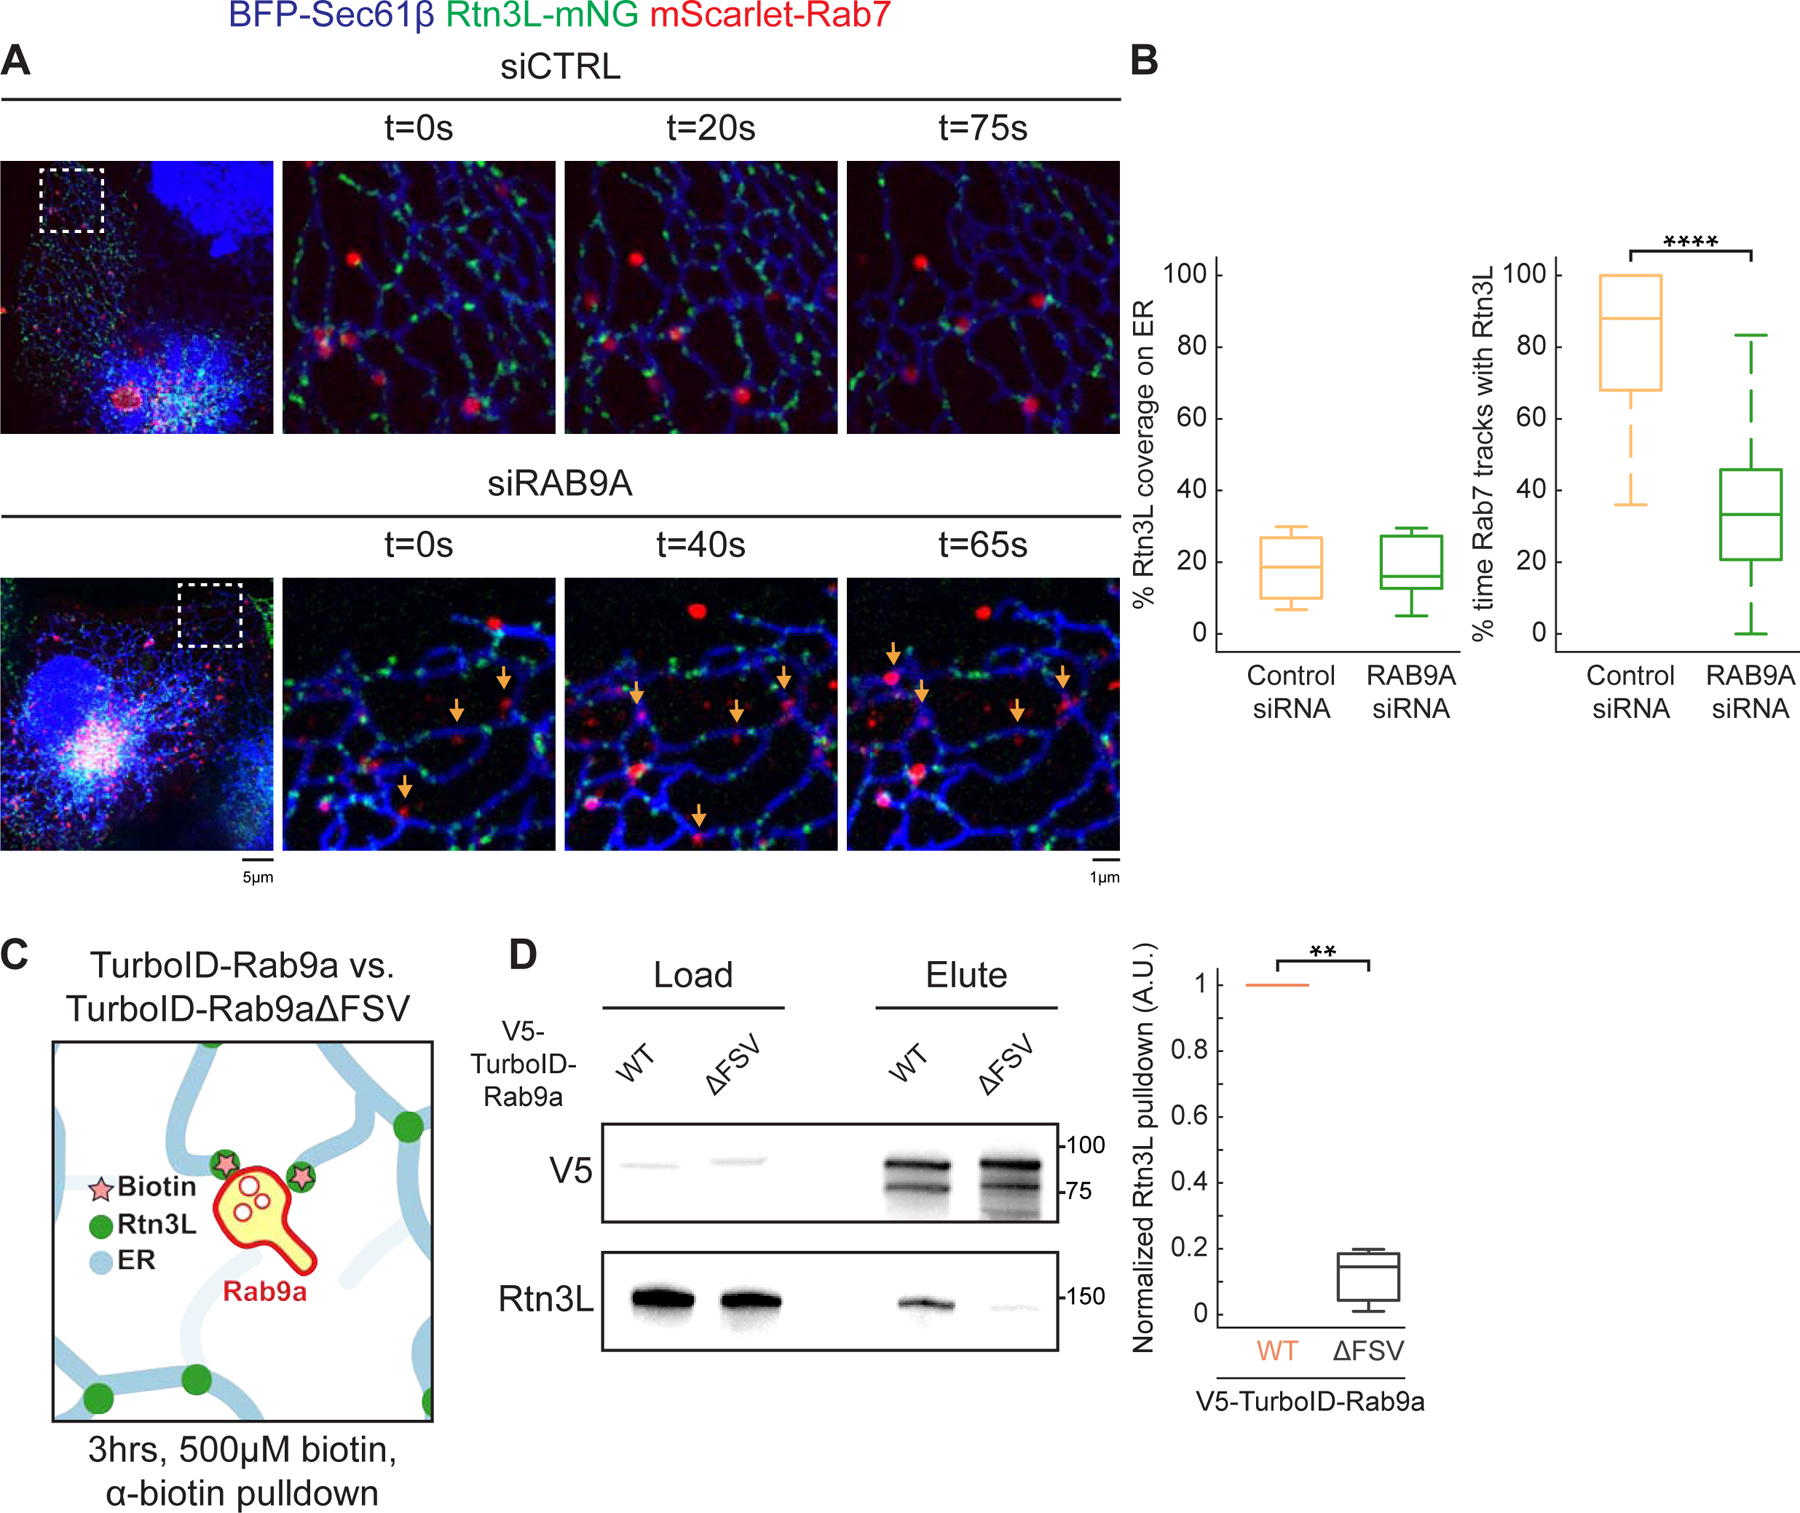
Figure 5. Rab9a recruits Rtn3L to ER-endosome MCSs.

(A) Representative images of control siRNA (siCTRL) and RAB9A siRNA (siRAB9A) treated COS-7 cells co-transfected with BFP-Sec61β (ER, blue), mCh-Rab7 (LEs, red) and Rtn3L-mNG (green). Time-lapse 10 x 10 µm insets are shown on the right. Orange arrows point at LEs in RAB9A-depleted cells that do not track with Rtn3L. (B) Quantification of Rtn3L coverage on ER tubules (left) and the percent of time Rab7 LEs track with Rtn3L in 2min movies (right). Data quantitated from siCTRL (66 endosomes, n= 10 cells) versus siRAB9A (56 endosomes, n=11 cells). (C) Cartoon diagram of experiment testing whether Rtn3L and Rab9a are within tethering distance. Briefly: HeLa cells expressing TurboID-Rab9a or V5-TurboID-Rab9aΔFSV (negative control) were treated with 500µM biotin for 3hrs. Biotinylated proteins were pulled-down by anti-biotin agarose beads. Eluted biotinylated proteins are assayed by immunoblot. (D) Representative V5 and Rtn3L immunoblot of load and elute of biotin pulldown (left), and the quantification of normalized Rtn3L biotinylated by V5-TurboID-Rab9a WT versus V5-TurboID-Rab9aΔFSV. All numbers normalized to V5-TurboID-Rab9a WT. Statistical analyses were performed with two-tailed student t-test: **p<0.01, ****p<0.0001. Scale bars = 5 µm, 1 µm for insets. See also Figure S5.
