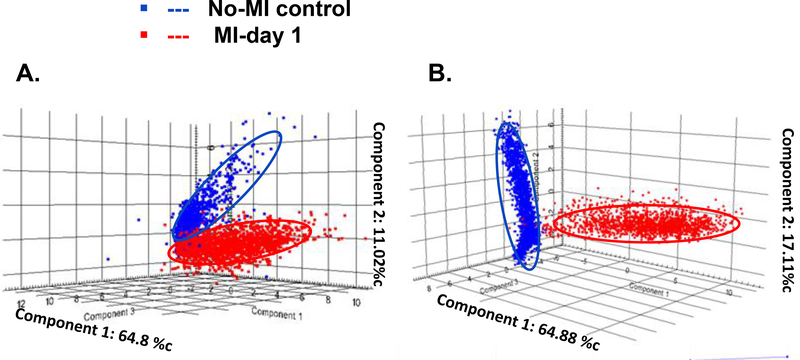
Figure 7:
Tri-dimensional PCA results using SCiLS Lab software in negative mode (A) and positive one (B) for the no-MI control (Blue) and MI-day 1 (red) left ventricle. A plot of principal component 1 (PC1-MI day 1) versus principal component 2 (PC2-no-MI control) was chosen since these components resulted in the highest overall degree of separation of the spectra within the PCA scores plots. At the top of each axis from the PCA, the percentage of explained data for each PC was reported.

