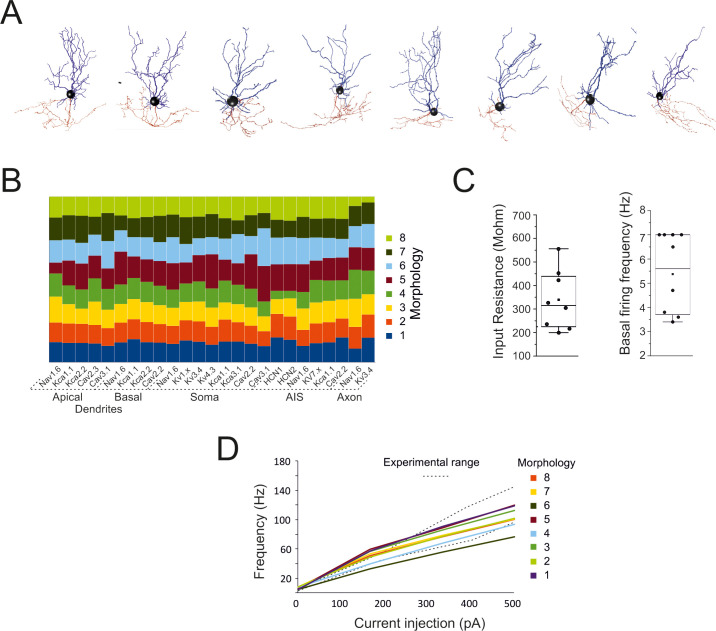
Fig 2. Quantitative aspects of Golgi cell models.
(A) The morphologies of the 8 Golgi cells used for modeling. (B) The table shows the balance of maximum ionic channel conductances in the 8 GoC models, demonstrating their similarity. (C) The box-and-whiskers plots show the distribution of input resistance (measured from current transients elicited by 100 ms steps from -70m to– 80 mV in the soma) and basal firing frequency. (D) Frequency-intensity curves for the 8 GoC models compared to the experimental range [dotted lines from [15]]. The same color code is used for the cells in B and D.

