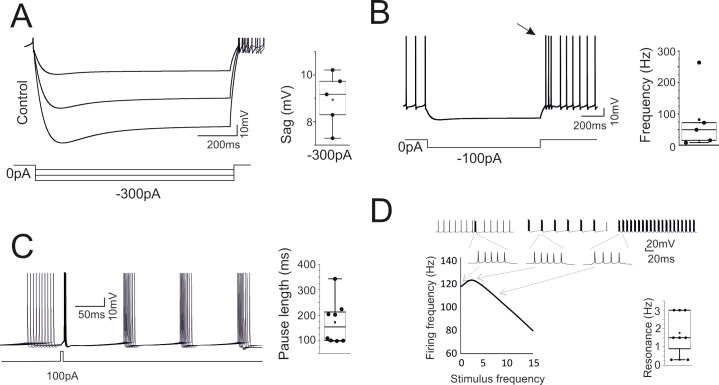
Fig 3. High level model validation: sags, rebounds, phase-reset and resonance.
The model was simulated in operating conditions capable of revealing typical GoC behaviors not considered for model construction. (A) Response to hyperpolarizing currents. The model generates sagging hyperpolarization. The box-and-whiskers plot shows sag amplitude in the 8 models. (B) Return to resting activity following hyperpolarizing currents. The model transiently generates a rebound burst (arrow). The box-and-whiskers plot shows burst frequency in the 8 models. (C) Responses following a depolarizing current pulse. The model shows phase-reset. The box-and-whiskers plot shows the pause length in the 8 models. (D) Responses following injection of current steps at different frequencies. The model shows resonance of output spike frequency. The traces illustrate the resonance protocol and an enlargement of the spike bursts used for measuring the output frequency. The box-and-whiskers plot shows resonance frequency in the 8 models.

