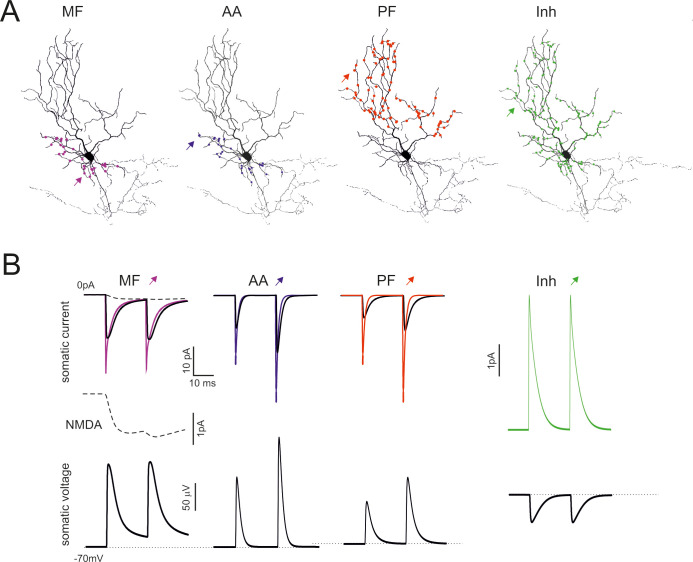
Fig 6. Model responses to synaptic inputs.
(A) The figure shows the localization of mossy fibers (MF), ascending axon (AA), parallel fiber (PF), and inhibitory (Inh) synapses. (B) Synaptic currents generated by single MF, AA, PF and Inh synapses. The thin line is the current generated at the synaptic site, the thin line is the current recorded in the soma. The dashed line is the NMDA current. The corresponding EPSPs and IPSPs are reported at the bottom. In all cases the responses are elicited by a stimulus pair at 50 Hz.

