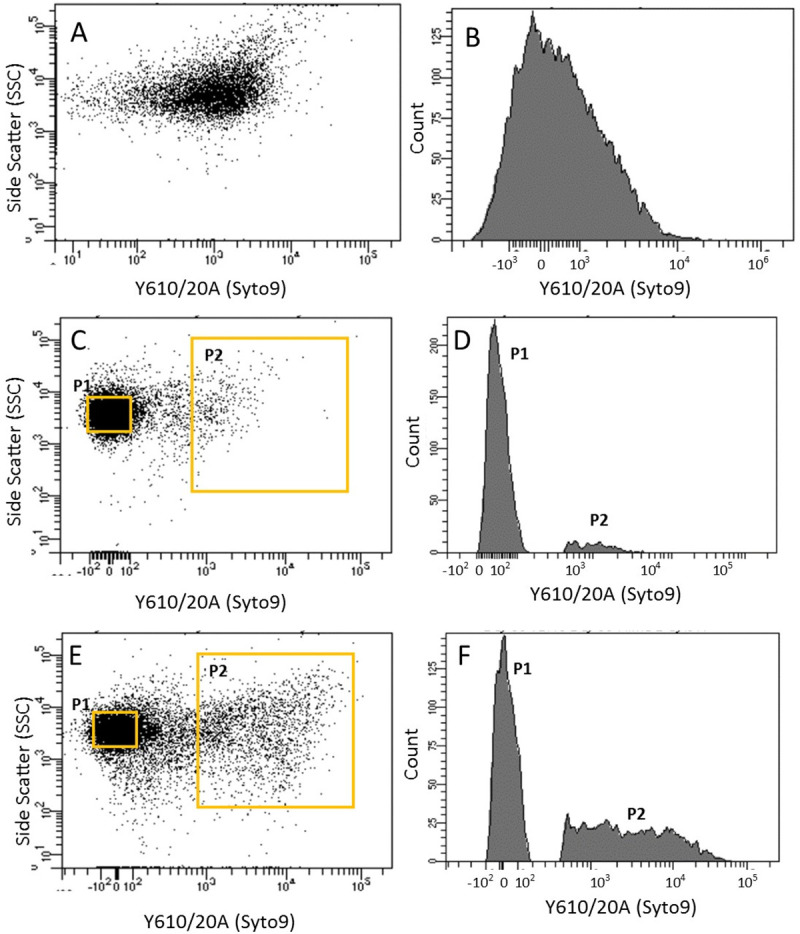
Fig 2. Flow cytometry analysis of microcosms.

Dot plots (Left) and corresponding histograms (Right) for Time point T0 (A-B), Time point T12 (C-D) and Time point T50 (E-F). Left: Dot plot of side scatter area vs. Y610/20 emission area management. Right: Line gate was used to select population P1 and P2 at T12 and T50 and plotted on a histogram of Y610/20 emission area to highlight proportions of cells in populations P1 and P2. Populations P1 and P2 became visible on dot plots and histograms once the cells in the microcosm population had turned unculturable. Intensity of fluorescence increased (as measured on the YG610/20 laser) and a peak on Y610/20 was seen which corresponded to a large side scatter.
