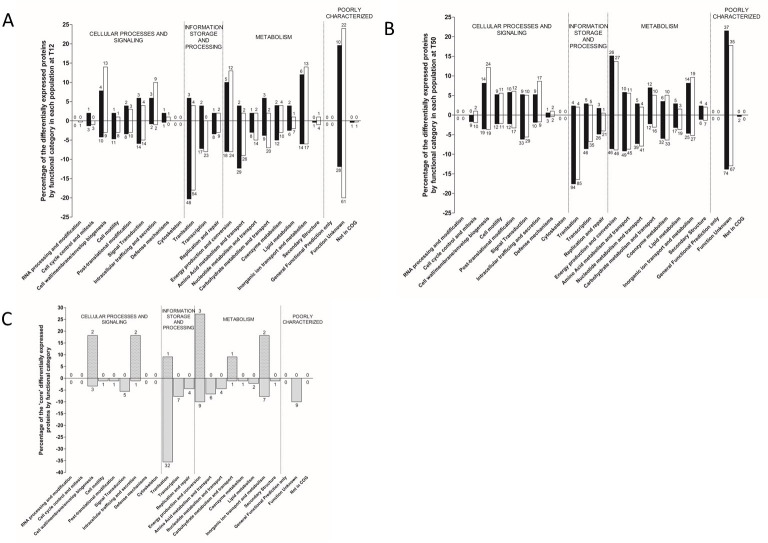
Fig 6. Functional categories of differentially expressed proteins of V. parahaemolyticus cells in the different VBNC subpopulations at each time point.
Only significant expressed proteins (q value < 0.01) with expressional changes of 3 or greater in VBNC subpopulation versus T0 are shown. Bars indicate the portion of the differentially expressed genes by functional category in each population (100% is the number of regulated proteins in subpopulations P1 or P2). The number of proteins in each category appears above the median (upregulated) or below the median bar (downregulated). A: shows proteins regulated at T12 time point B: shows proteins regulated at T50 time point and C: shows core proteins that are shared in subpopulations P1 and P2 at both time points T12 and T50. Subpopulation P1 is in solid white bars while subpopulation P2 is in solid black bars.

