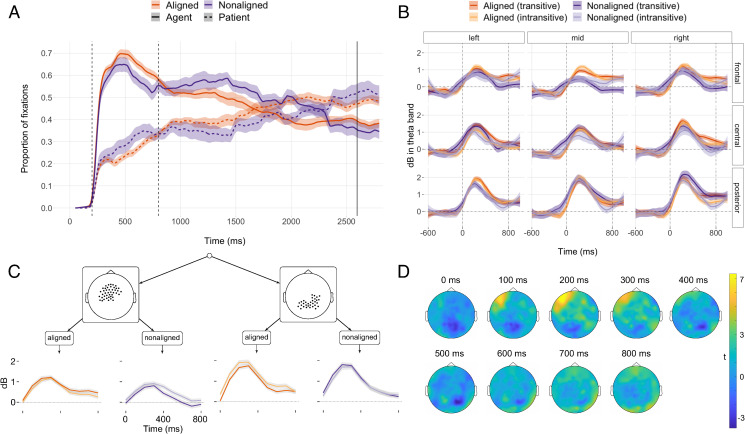
Fig 2.
(A) Smoothed grand average of proportions of eye fixations to agent and patient characters in the picture stimuli during planning of transitive sentences (“The gardener plants trees” and “The gardener+x planted trees”). The solid vertical line represents speech onset (grand mean of transitive sentence responses). Overall, the planning of aligned sentences reveals more visual attention to agents (p < 0.001 in linear mixed-effects regression). (B) Smoothed grand average of event-related power changes (dB relative to a baseline period of −600 to −200 ms) in individually defined theta frequency bands. Grid cells in this panel represent ROIs (see S7 Table for details). Dashed vertical lines (in A and B) indicate analysis time windows, ribbons indicate standard errors, and t = 0 is the onset of stimulus picture presentation. (C) Regression model tree for power changes in individually defined theta frequency bands between 0 and 800 ms. Scalp maps show electrode positions of ROIs included in the respective grouping. All splits are statistically significant at p < 0.001. Tree tips show model fits for the respective grouping; ribbons represent 95% CIs, and colors code the same distinctions as in A and B. The model also identified lower-order splits which are subsidiary to the main difference between aligned and nonaligned sentences (see S4 Fig, S5 Table). (D) Topographic maps of power differences of aligned minus nonaligned sentences in t-values for a fixed theta frequency band (3–7 Hz). (Underlying data and scripts are available from https://osf.io/uhtcn/ and in the Supporting information file S1 Data.) Overall, the planning of aligned sentences reveals ERS (more positive dB) in the theta band. ERS, event-related synchronization; ROI, region of interest.

