Figure 3.
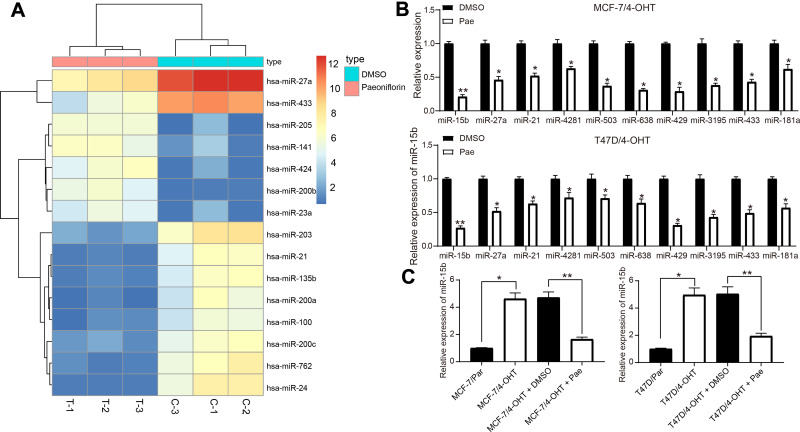
Pae downregulates miR-15b expression in 4-OHT-resistant BC cells. (A) the heatmap of some differentially expressed miRNAs in MCF-7/4-OHT cells; (B) the expression of the top 10 differentially expressed miRNAs in MCF-7/4-OHT cells determined by RT-qPCR; (C) the expression of miR-15b in parental and drug-resistant cells measured by RT-qPCR. Data are displayed in the form of mean ± SD. All experiments were repeated at least three times. In panel (B) two-way ANOVA along with Tukey’s multiple comparison was applied, while in panel (C) one-way ANOVA along with Tukey’s multiple comparison was used. *p < 0.05, **p < 0.01.
Abbreviations: Pae, paeoniflorin; BC, breast cancer; miR, microRNA; 4-OHT, 4-hydroxytamoxifen; SD, standard deviation; ANOVA, analysis of variance.

