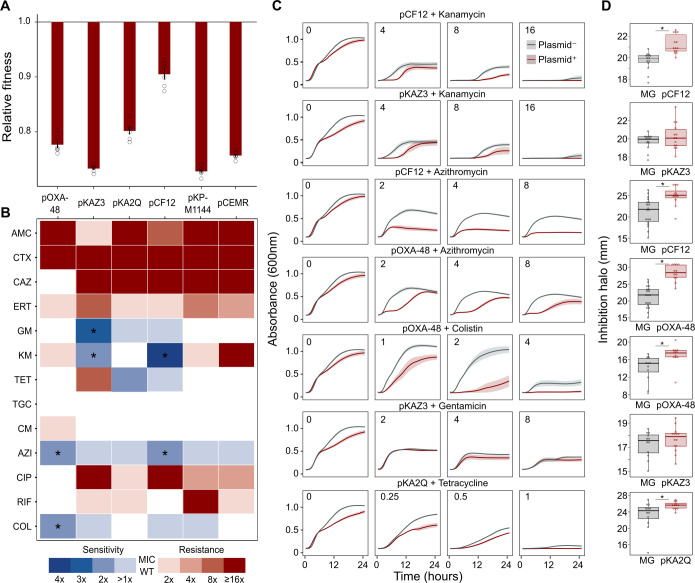
Figure 1. Collateral sensitivity and fitness effects associated with antibiotic resistance (ABR) plasmids.
(A) Competition assay determined fitness of plasmid-carrying clones relative to the plasmid-free MG1655 strain. Bars represent the means of six independent experiments (represented by dots), and error bars represent the standard error of the mean. (B) Heat-map representing collateral responses to antibiotics associated with plasmid acquisition. The color code represents the fold change of MIC in plasmid-carrying derivatives compared to plasmid-free MG1655 (see legend). Asterisks indicate a significant ≥2 fold decrease in MIC (Mann-Whitney U test; p<0.015). AMC, amoxicillin-clavulanic acid; CTX, cefotaxime; CAZ, ceftazidime; ERT, ertapenem; GM, gentamicin; KM, kanamycin; TET, tetracycline; TGC, tigecycline; CM, chloramphenicol; AZI, azithromycin; CIP, ciprofloxacin; RIF, rifampicin; and COL, colistin. (C) Growth curves of MG1655 and plasmid-carrying MG1655 strains exposed to increasing antibiotic concentrations. The antibiotic concentration, in mg/L, is indicated at the top left corner of each panel. Lines represent the mean of 6 biological replicates, and the shaded area indicates standard error of the mean. (D) Boxplot representations of the inhibition halo diameters, in mm, obtained from disk-diffusion antibiograms of plasmid-free and plasmid-carrying MG1655. Plasmid/antibiotic combinations in each row are the same as the ones indicated in panel C. Horizontal lines within boxes indicate median values, upper and lower hinges correspond to the 25th and 75th percentiles, and whiskers extend to observations within 1.5 times the interquartile range. Individual data points are also represented (11–15 biological replicates). Asterisks indicate statistically significant differences (unpaired t-test with Welch’s correction p<0.044).


