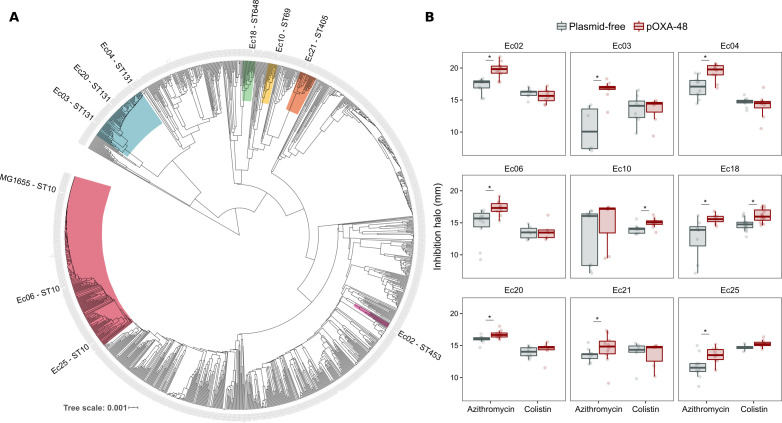
Figure 2. Phylogeny and collateral sensitivity profiles of E. coli clinical isolates.
(A) Phylogenetic tree of E. coli species, highlighting the strains used in this study and their sequence types (ST). Colors within tree branches represent different STs. The tree depicts the phylogenetic relationships of 1344 representative E. coli genomes obtained from NCBI. (B) Representation of the inhibition halo diameters, in mm, obtained from disk-diffusion antibiograms of clinical isolates and their transconjugants carrying pOXA-48. Horizontal lines inside boxes indicate median values, upper and lower hinges correspond to the 25th and 75th percentiles, and whiskers extend to observations within 1.5 times the interquartile range. Individual data points are also represented (6–12 replicates, jittered to facilitate data visualization). Asterisks denote statistically significant differences (t-test with Welch’s correction p<0.035 in all cases).

