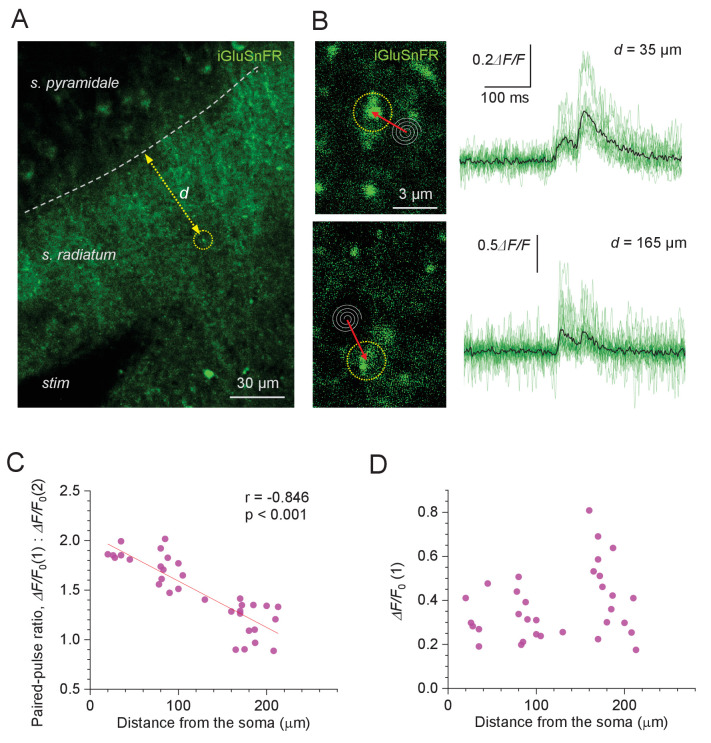
Figure 3. Evoked glutamate release from Schaffer collaterals shows lower paired-pulse ratios at greater distances from pyramidal cell bodies.
(A) Experimental design: area of the hippocampal slice with iGluSnFR expressed in neuronal membranes (green channel); arrow, measured distance d between CA1 pyramidal cell body layer and the axonal bouton of interest; stim, stimulating electrode. (B) Examples of recorded axonal boutons (image panels, dotted circles; position of spiral 'Tornado' linescans is illustrated) showing characteristic glutamate signals in response to two afferent stimuli 50 ms apart (green traces, individual trials; black, average), at two distances from the s. pyramidale, as indicated. The lack of release failures reflects detection of glutamate escaping from multiple neighbouring synapses. (C) Paired-pulse ratio for optical glutamate signals: ΔF/F0(1) / ΔF/F0(2) averaged over 18–36 trials at individual boutons, plotted against distance to the soma. Other notations as in Figure 1C (n = 33). (D) Amplitude of the first glutamate response, ΔF/F0(1) averaged over 18–36 trials at individual boutons, plotted against distance to the soma. The amplitude values reflect the average amount of glutamate released from the bouton of interest, and glutamate escaping from its neighbours; other notations as in (C) (n = 33).


