. 2021 Jan 26;10:e64833. doi: 10.7554/eLife.64833

Figure 2. Deleting Mecp2 from the cerebellum, but not its neuronal subtypes, causes motor learning deficits in 6-month-old mice.

(A) Breeding scheme to generate WT, Cre, Flox, and KO mice. (B) Latency to fall on the rotarod over four training days in the En1Cre group. (C) Latency to fall on the rotarod over four training days in mice lacking Mecp2 in the granule cells (Atoh1Cre), Purkinje cells (Pcp2Cre), and Purkinje cells and molecular layer interneurons (Ptf1aCre). (D) Schematic of eyeblink conditioning that pairs an LED light (conditioned stimulus, cs) with an air puff (unconditioned stimulus, us) to generate an anticipatory eyelid closure (conditioned response) before the air puff. (E) Response probability and amplitude of eyelid closure over 12 training days in Flox and KO mice. N = 8–17 biologically independent mice per group. Data are presented as mean ± s.e.m. Statistical significance was determined by two-way ANOVA with Tukey’s multiple comparisons test. ns (p>0.05), *(p<0.05), **(p<0.01), ****(p<0.0001).

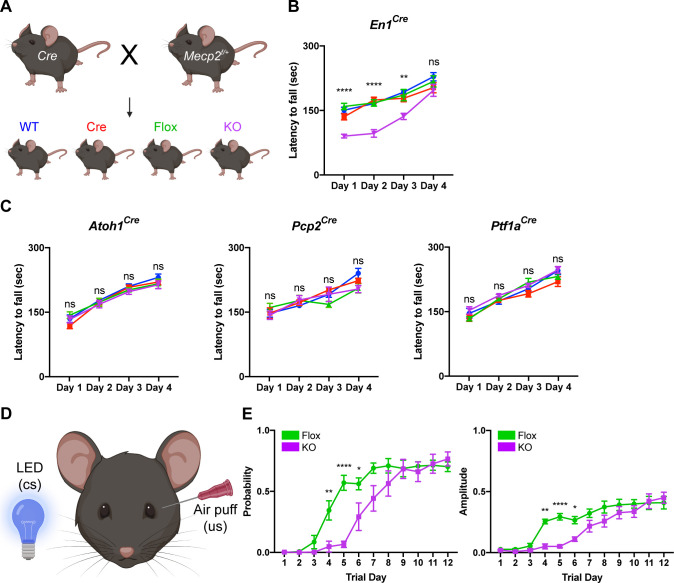
Figure 2—source data 1. Related to Figure 2.

Figure 2.

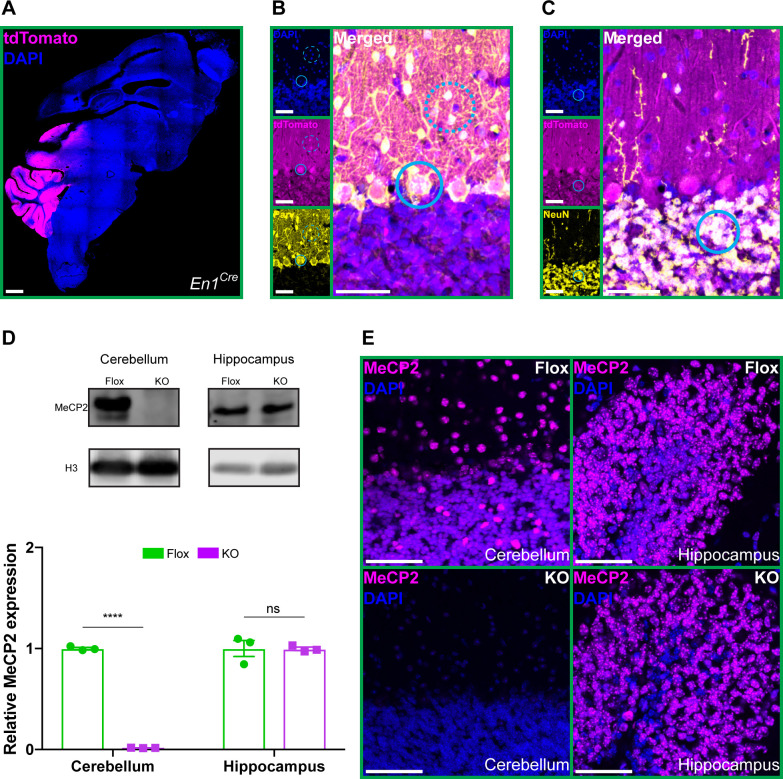
Figure 2—figure supplement 1. Deletion of Mecp2 from the cerebellum.

Figure 2—figure supplement 1.

(A) En1Cre expression was determined by the pattern of tdTomato (magenta) in En1Cre;Rosa26lsl-tdTomato reporter mice. Scale bar, 1 mm. (B) Immunostaining showing co-expression of tdTomato (magenta) with Parvalbumin (yellow), a marker of Purkinje cells (solid cyan circle), and molecular layer interneurons (dashed cyan circle). Scale bar, 25 µm. (C) Immunostaining showing co-expression of tdTomato (magenta) with NeuN (yellow), a marker of granule cells (solid cyan circle). Scale bar, 25 µm. (D) Quantification of MeCP2 protein levels normalized to Histone H3 in the cerebellum and hippocampus of Flox and KO mice. (E) Immunostaining of MeCP2 (magenta) in the cerebellum and hippocampus of Flox and KO mice. Scale bar, 50 µm. N = 3 biologically independent mice per group. Data are presented as mean ± s.e.m. Statistical significance was determined by two-tailed, unpaired student’s t-test. ns (p>0.05), ****(p<0.0001).
Figure 2—figure supplement 1—source data 1. Related to Figure 2—figure supplement 1.
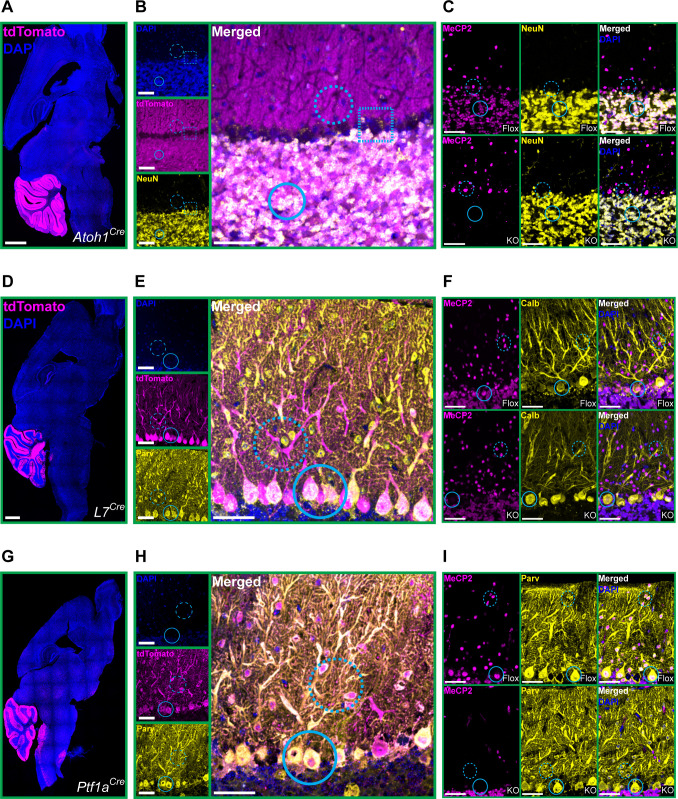
Figure 2—figure supplement 2. Cre expression and Mecp2 deletion in cerebellar neuron subtypes.

Figure 2—figure supplement 2.

(A) Atoh1Cre expression was determined by the pattern of tdTomato (magenta) in Atoh1Cre;Rosa26lsl-tdTomato reporter mice. Scale bar, 1 mm. (B) Immunostaining in Atoh1Cre;Rosa26lsl-tdTomato reporter mice showing co-expression of tdTomato (magenta) with NeuN (yellow), a marker of granule cells (solid cyan circle), but not in cells of the Purkinje layer (dashed cyan square) or molecular layer (dashed cyan circle). Scale bar, 25 µm. (C) Immunostaining of MeCP2 (magenta) and NeuN (yellow) in the cerebellum showing the absence of MeCP2 in granule cells of KO mice (solid cyan circle), but not in cells of the Purkinje layer (dashed cyan circle). Scale bar, 25 µm. (D) Pcp2Cre expression was determined by the pattern of tdTomato (magenta) in Pcp2Cre;Rosa26lsl-tdTomato reporter mice. Scale bar, 1 mm. (E) Immunostaining in Pcp2Cre;Rosa26lsl-tdTomato reporter mice showing co-expression of tdTomato (magenta) with Parvalbumin (yellow) in the Purkinje cell layer (solid cyan circle), but not the molecular layer (dashed cyan circle). Scale bar, 25 µm. (F) Immunostaining of MeCP2 (magenta) and Calbindin (yellow) in the cerebellum showing the absence of MeCP2 in Purkinje cells of KO mice (solid cyan circle), but not in molecular layer interneurons (dashed cyan circle). Scale bar, 25 µm. (G) Ptf1aCre expression was determined by the pattern of tdTomato (magenta) in Ptf1aCre;Rosa26lsl-tdTomato reporter mice. Scale bar, 1 mm. (H) Immunostaining in Ptf1aCre;Rosa26lsl-tdTomato reporter mice showing co-expression of tdTomato (magenta) with Parvalbumin (yellow) in the Purkinje layer (solid cyan circle) and molecular layer (dashed cyan circle). Scale bar, 25 µm. (I) Immunostaining of MeCP2 (magenta) and Parvalbumin (yellow) in the cerebellum showing the absence of MeCP2 in Purkinje cells (solid cyan circle) and molecular layer interneurons of KO mice (dashed cyan circle). Scale bar, 25 µm.
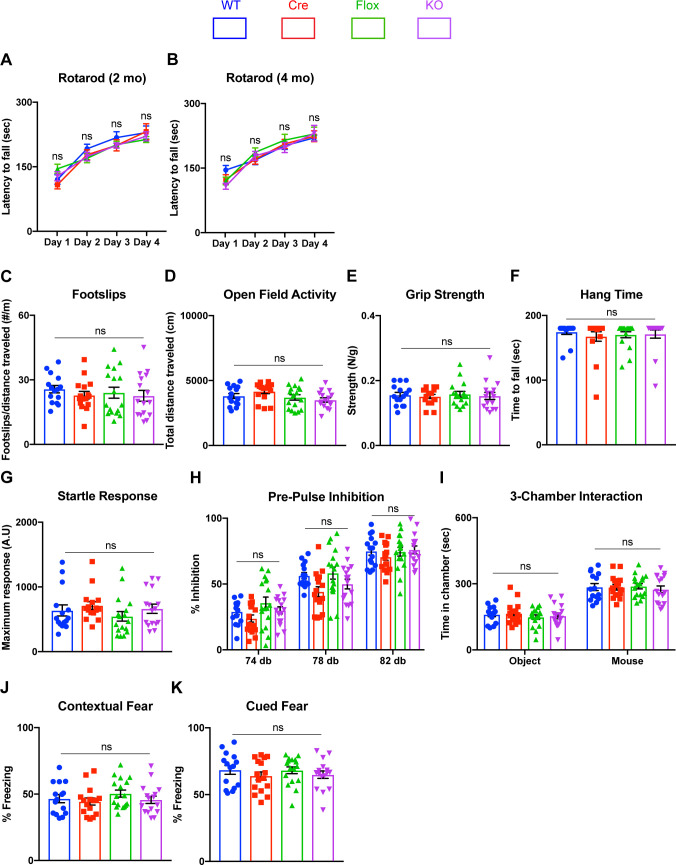
Figure 2—figure supplement 3. Deleting Mecp2 from the cerebellum does not cause other behavioral abnormalities.

Figure 2—figure supplement 3.

(A) Latency to fall on the rotarod in 2-month-old mice. (B) Latency to fall on the rotarod in 4-month-old mice. A new cohort of WT, Cre, Flox, and KO mice was assessed for each time point. (C) Footslip count on the parallel rod assay normalized to total distance traveled. (D) Total distance traveled in the open-field assay. (E) Grip strength normalized to body weight. (F) Hang time on an inverted wire grid. (G) Maximum acoustic startle response to a 120 dB stimulus. (H) Pre-pulse inhibition to 74, 78, and 82 dB pre-pulses. (I) Interaction time in the three-chamber social interaction assay between a novel mouse or object. (J) Time spent freezing during contextual memory recall. (K) Time spent freezing during cued memory recall. N = 10–17 biologically independent mice per group. For (C–K), mice are 6 months old. Data are presented as mean ± s.e.m. Statistical significance was determined by one-way (C–G, J–K) or two-way ANOVA (A–B, H–I) with Tukey’s multiple comparisons test. ns (p>0.05).
Figure 2—figure supplement 3—source data 1. Related to Figure 2—figure supplement 3.