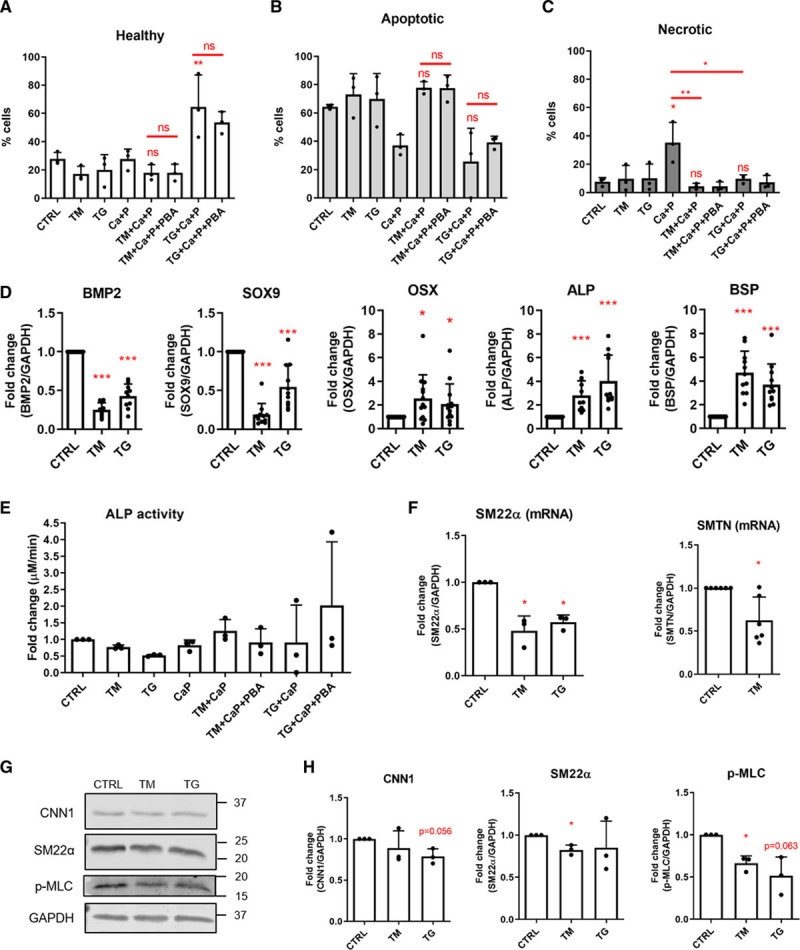
Figure 3.

Endoplasmic reticulum (ER) stress modulated vascular smooth muscle cell (VSMC) phenotype. A–C, VSMCs were treated with 2.7 mmol/L Ca2+, 2.5 mmol/L PO43-, 0.04 μg/mL tunicamycin (TM), or 0.01 μg/mL thapsigargin (TG), 0.5 mmol/L 4-phenylbutyric acid (PBA) for 8 d in M199 with 5% FBS. Cell death was analyzed with the NucleoCounter NC-3000 using a FLICA caspase assay and propidium iodide staining, where cells are described as healthy, apoptotic, or necrotic. Graph shows mean+SD and individual data points, ANOVA with Tukey post hoc test was performed. Statistical significance is marked for Ca+P vs Ca+P and TM/TG or as indicated with brackets. D, VSMCs were treated with 0.4 μg/mL TM or 0.2 μg/mL TG for 24 h. Osteogenic gene expression in response to ER stress was analyzed by real-time polymerase chain reaction (PCR). Graphs show mean+SD, 1-sample t tests (BMP-2 [bone morphogenetic protein 2], SOX9 [SRY-box transcription factor 9], BSP [bone sialoprotein]), and 1-sample Wilcoxon tests (OSX [Osterix], ALP [alkaline phosphatase]) were performed. E, VSMCs were treated with 2.7 mmol/L Ca2+, 2.5 mmol/L PO43-, 0.04 μg/mL TM or 0.01 μg/mL TG, 0.5 mmol/L PBA for 8 d in M199 with 5% FBS. ALP activity was measured using a colorimetric assay. Graph shows mean+SD and individual data points, Kruskal-Wallis test was performed. F, Analysis of SM22α (smooth muscle protein 22α) and SMTN (smoothelin) expression by real-time PCR. One-sample t tests were performed. G, Representative western blots of CNN1 (calponin 1), SM22α, and p-MLC (phosphorylated myosin light chain) and H, quantifications. Graphs show mean+SD and individual data points, 1-sample t tests were performed. CTRL indicates control. Dots denote individual data points, *P<0.05, **P<0.01, ***P<0.001.
