. 2021 Jan 26;10:e64166. doi: 10.7554/eLife.64166

Figure 4. Proteome array analysis of immune-sera against L1-130 fcpA- attenuated-vaccine.

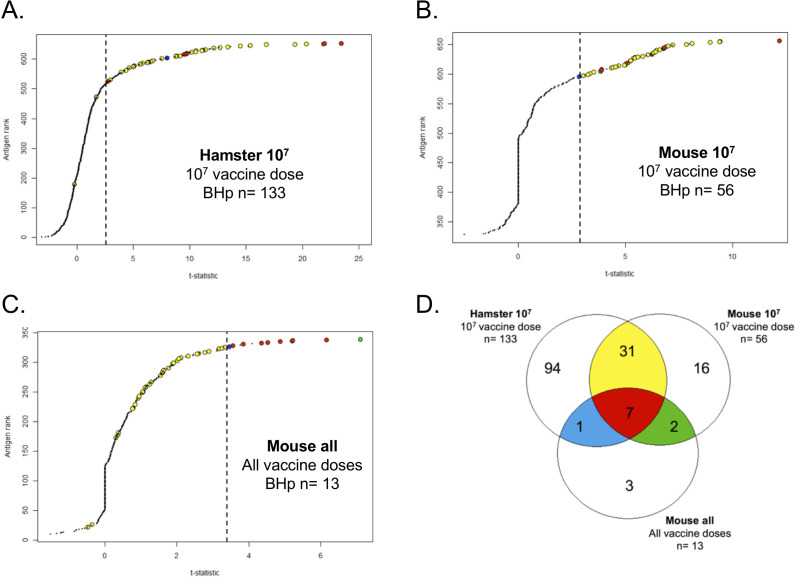
Using statistical modeling we calculated the t-statistics value for each individual antigen used in the proteome array (660 for hamster and 330 for mice) based on three groups: the contrast between vaccinated and unvaccinated hamsters (A) or mice (B) using a vaccine dose of 107 leptospires; the dose–response relationship for each antigen on mice (C) vaccinated with a range of doses from 107 to 101 leptospires of the attenuated-vaccine. Results are ranked based on individual t-statistics values for each antigen, and the dashed line represents the selection point for the antigens based on Bhp-test. The Venn-diagram (D) shows the relationship of all the 154 antigens identified in the three groups. The subgroups of antigens selected for further characterization are highlighted in color. See Figure 5.

Figure 4—source data 1. Raw data of proteome array experiments in hamster and mouse.

Figure 4.

Figure 4—figure supplement 1. In-silico analysis of protein targets.

Figure 4—figure supplement 1.

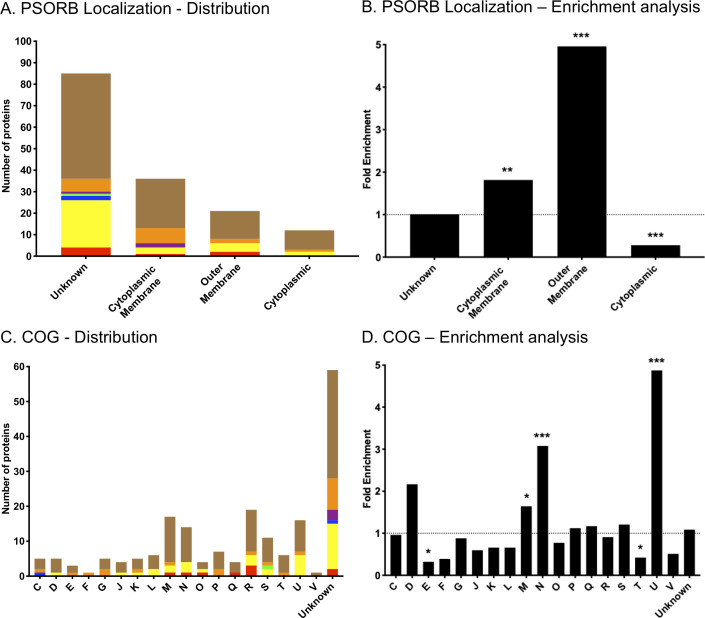
Using PSORB information and Genoscope database, we classified the 154 protein targets identified in this study by their putative localization in the cell (A) and their clusters of orthologous group (COG) classification (C). The groups of proteins are classified as follows: proteins identified in all three groups analyzed (7, red); proteins identified in both hamster and mouse vaccinated with a dose of 107 leptospires of the attenuated-vaccine (31, yellow); proteins identified between the group of mice immunized with different doses and the group of mice immunized with a dose of 107 leptospires (2, green); proteins identified between the group of mice immunized with different doses and the group of hamsters immunized with a dose of 107 leptospires (1, blue); proteins identified only in the group of mice immunized with different doses (3, purple); proteins identified only in the group of mice immunized with a dose of 107 leptospires (16, orange); and proteins identified only in the group of hamsters immunized with a dose of 107 leptospires (94, brown). We also performed enrichment analysis of the reactive antigens compared to the whole proteome of Leptospira, based on the PSORB localization (B) and COG (D). Statistical results are represented by *(p<0.05), **(p<0.001), and ***(p<0.0001). See Supplementary file 4.
Figure 4—figure supplement 2. Mouse dose–response relationship.
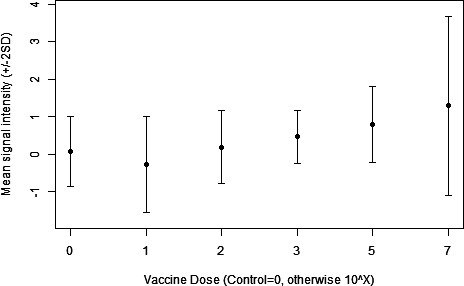
Figure 4—figure supplement 2.

Analysis showing an association between the different doses of the attenuated L1-130 fcpA- attenuated-vaccine in mice and the mean signal response intensity against all different proteins.