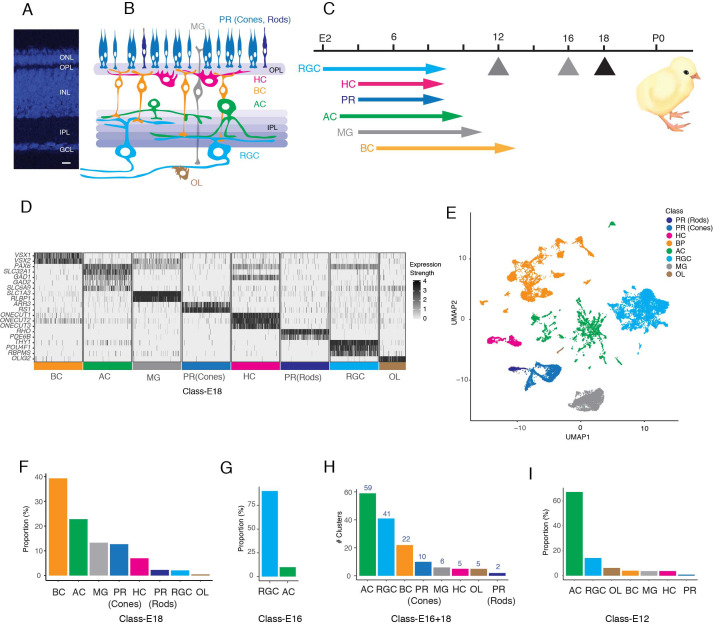
Figure 1. Datasets used to generate a chick retinal atlas.
(A) Cross-section of chick retina stained with NeuroTrace to mark somata. The retina consists of three cellular layers: outer nuclear layer (ONL), inner nuclear layer (INL), and ganglion cell layer (GCL) separated by two synaptic layers, outer plexiform (OPL) and inner plexiform (IPL). Bar, 10 µm. (B) Sketch showing retinal cell classes. The ONL contains photoreceptors (PR): double cones, single cones, and rods. The INL contains horizontal, bipolar, and amacrine cells (HC, BC, and AC) and Müller glia (MG). The GCL contains retinal ganglion cells (RGCs) and ACs. Oligodendrocytes (OL) are present in an axonal layer beneath the GCL. (C) Birthdates of each class, from Prada et al., 1991. Hatching (P0) is at embryonic day (E)21. Arrows denote ages at which cells were obtained for scRNA-seq. To generate the cell atlas, E16 data were used for RGCs and E18 data for all other classes. (D) Expression of a subset of marker genes used to allocate E18 retinal cells to classes. Plot shows scaled expression level in a randomly down-sampled subset of all cells. (E) UMAP of E16+18 scRNA-seq data with class names based on D. (F) Fraction of E18 cells in each cell class, as determined by expression of canonical markers in D. (G) Fraction of E16 RGC-enriched cells in each cell class, determined as in D, F. (H) Number of clusters (putative cell types) in each retinal cell class, based on reclustering each class separately. (I) Fraction of E12 RGC-enriched cells in each cell class, determined as in D, F.


