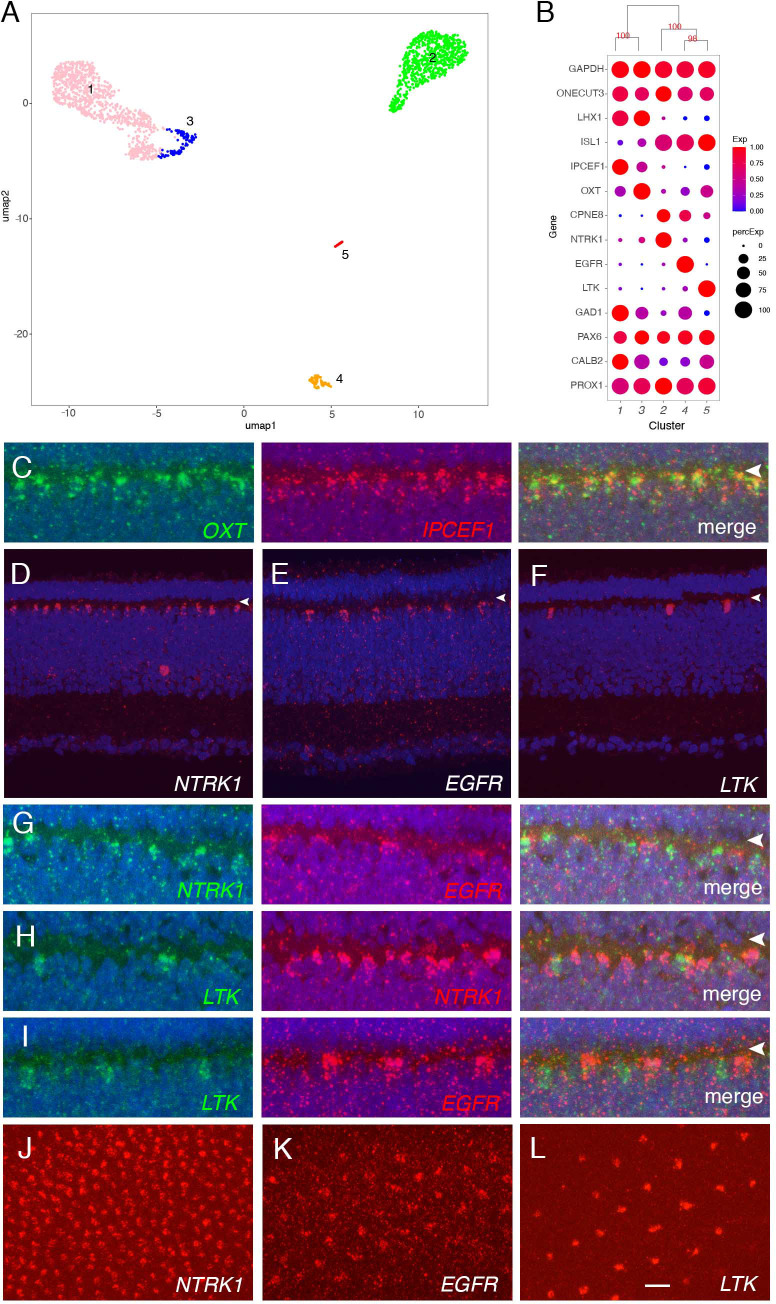
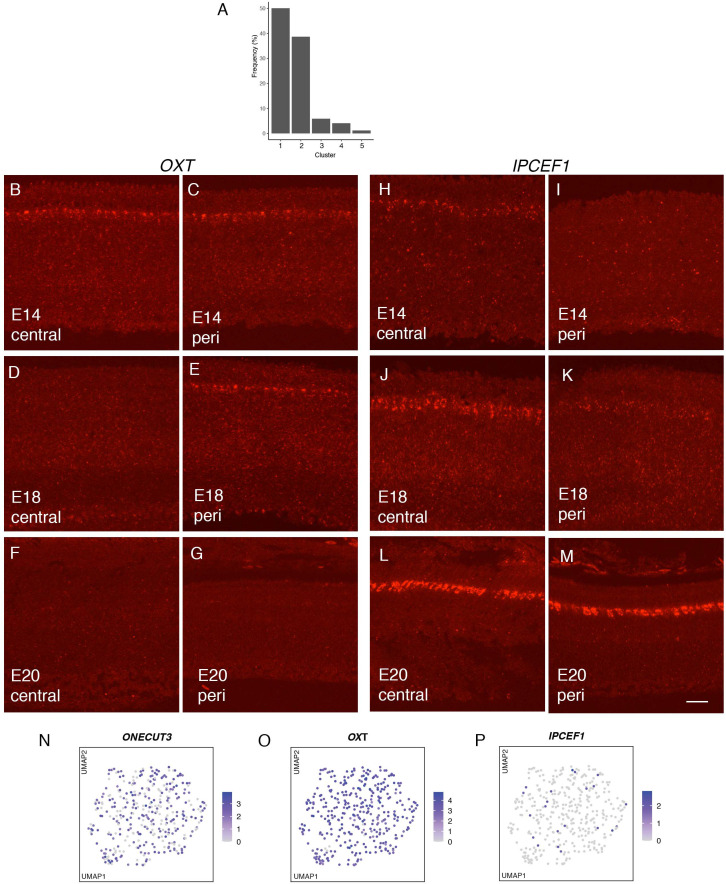
Figure 4. Classification and characterization of horizontal cells (HC).
(A) Clustering of E18 HCs viewed by UMAP. (B) Dot plots showing expression of selected genes expressed in all or subsets of HCs. Numbers correspond to clusters in A. Dendrogram above dots shows transcriptional relationships of clusters. (C–L) In situ hybridization with indicated probes at E16. C–I are cross-sections; J–L are en face sections. Arrowheads in C–I mark OPL. (C) Double color in situ hybridization shows coexpression of OXT and IPCEF1. (D–F) Expression of NTRK (D), EGFR (E), and LTK (F) in subsets of HCs. (G–I) Double color in situ hybridization for NTKR/ EGFR (G), LTK/ NTRK (H), and LTK /EGFR (I). (J–L) In situ hybridization of E16 en face sections for NTRK (J), EGFR (K), and LTK (L) showing mosaics of each type. Bar in L, 5 µm for C, G–I; 10 µm for D–F, J–L.


