. 2021 Jan 4;10:e63907. doi: 10.7554/eLife.63907

Figure 6. Classification and characterization of amacrine cells (ACs).

(A) Clustering of E18 ACs using UMAP. (B) Dot plots showing expression of the housekeeping gene, GAPDH; pan-AC genes PAX6 and SLC32A1; genes diagnostic of GABAergic ACs (SLC6A1, GAD1, GAD2) and glycinergic ACs (SLC6A9); and TFAP2 isoforms, TFAP2A and TFAP2B. Numbers correspond to clusters in A. Dendrogram above dots shows transcriptional relationships of clusters. (C) Genes expressed by subsets of ACs. (D,E) Immunostaining of E16 retina for TFAP2A (D) and TFAP2B (E). TFAP2A is expressed by multiple amacrine types in INL but not in GCL. (F) Immunostaining of E16 retina for CHAT, which is expressed by ON and OFF starburst ACs. Bar in E is 10 µm for D,E. Bar in F is 10 µm for F.

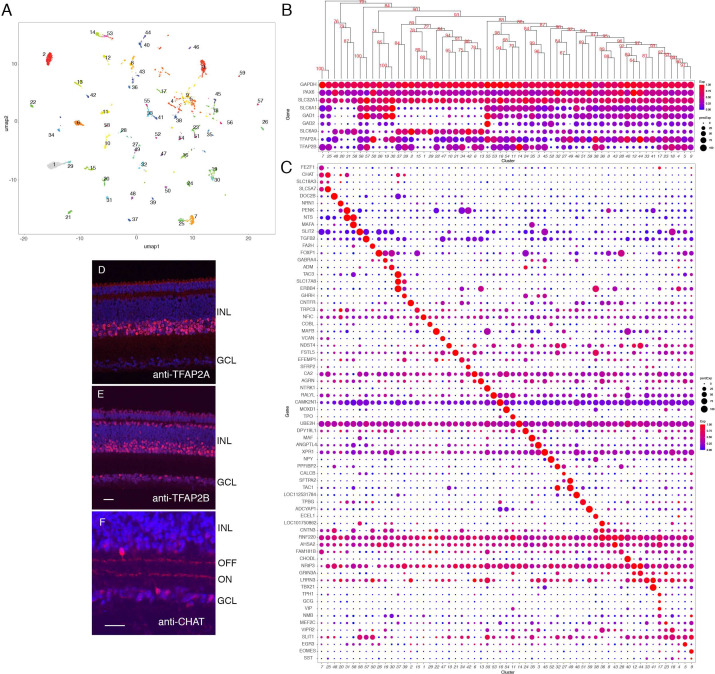
Figure 6.

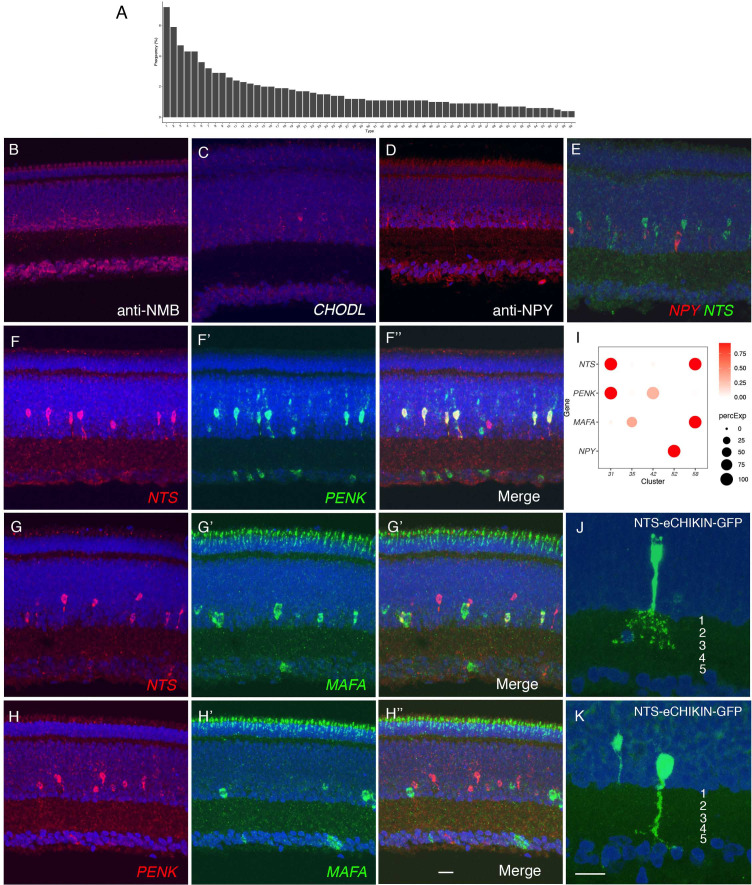
Figure 6—figure supplement 1. Frequency distribution and morphological analysis of amacrine cell types.

Figure 6—figure supplement 1.

(A) Frequency distribution of amacrine cells (ACs). Cluster Numbers are from Figure 6A,B. B–D, Immunostaining for NMB in AC17 (B), CHODL in AC40 (C), NPY in AC52 (D). (E–H) Double color in situ hybridization for NPY and NTS (E). NTS and PENK (F), NTS and MAFA (G) and PENK and MAFA (H). (I) Expression of NTS, PENK, MAFA, and NPY in selected AC clusters. (J,K) eCHIKIN-mediated labeling of NTS ACs. Two types of cells are labeled: PENK-expressing AC31 populate the top of the AC layer, and send arbors in S1–S3 (I), and MAFA-expressing AC58 is at the edge of IPL, and ramifies along S5 (J). Retinas are from E16 (B–H) or E14 (J,K). Bar in H is 10 µm for B–H. Bar in K is 10 µm for J and K.
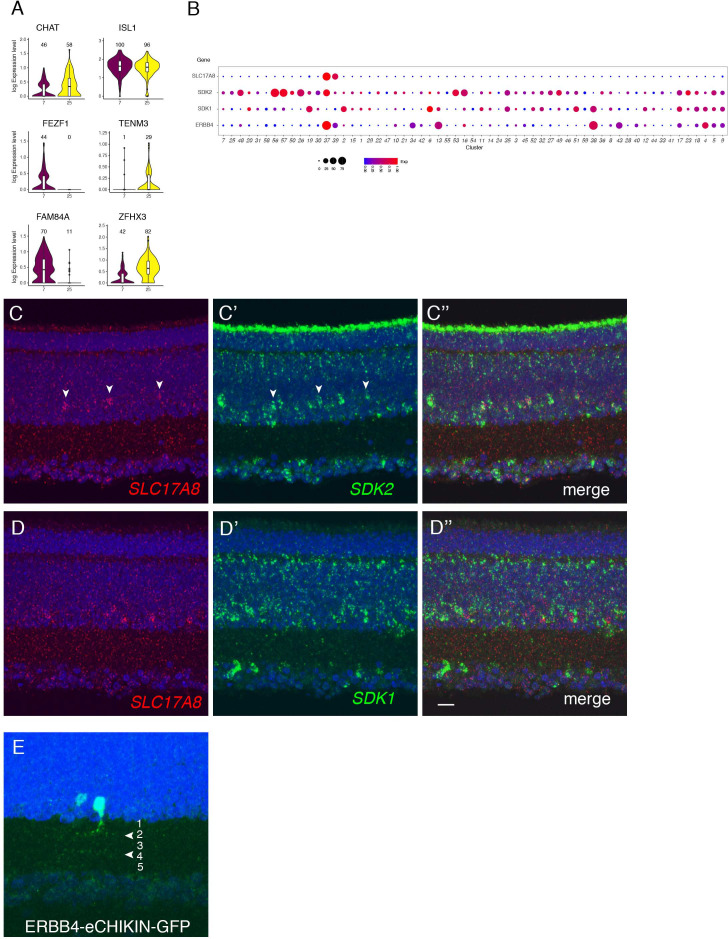
Figure 6—figure supplement 2. Molecular and morphological analysis of key amacrine cell types.

Figure 6—figure supplement 2.

(A) Violin plots showing differentially expressed genes in two clusters of E18 chick starburst ACs which are characterized by similar expression of CHAT and ISL1. (B) Dot plots of SLC17A8 (VGLUT3), SDK2, SDK1, and ERBB4 expression in amacrine cells (ACs). (C,D) Double-color in situ hybridization of E16 retina for SLC17A8 (arrowheads) plus SDK2 (C), or SDK1 (D). (E) eCHIKIN-mediated GFP insertion in ERBB4 at E14. The visualized cell stratifies along S2/S4 (arrowheads) which correspondes to SDK2 localization (Yamagata et al., 2002). See Figure 5—figure supplement 1F for overall expression pattern of ERBB4. Bar in D is 5 µm for C,D. Bar in E is 10 µm.